
How North Korea Pays for the Bomb—and Makes Its People Pay for Survival
Kim Jong Un’s new bridges to China and Russia reveal an economy less isolated than it looks, and a state increasingly able to secure resources without giving its citizens greater economic freedom
Roberto Balbino | FINTECH SCB | Sunday, 25 October 2026
A bridge across the Yalu River is a useful place to reconsider what we think we know about North Korea.
On 24 October, the Financial Times reported that Kim Jong Un had crossed the newly opened bridge into Dandong to reaffirm relations with China. Daniel Tudor and Edward White described a three-kilometre, four-lane crossing that had finally opened twelve years after its construction, alongside a visit involving senior Chinese officials and the commemoration of Chinese soldiers who fought in the Korean War. A new bridge connecting North Korea and Russia had opened the previous month. [1]
The temptation is to call this an opening. In a physical sense, it is. More capacity across a border can reduce transport constraints and support larger movements of goods. But a road can widen a government’s economic options without widening the freedoms of the people who live under it.
The more consequential development is that Kim has more than one powerful neighbour interested in what North Korea can provide. China remains its dominant recorded trading partner. Russia has become a major customer for its military capabilities. For Pyongyang, that changes the bargaining environment. A government dependent on one patron must worry about that patron’s conditions. A government useful to two patrons can try to negotiate with each from a stronger position.
This is an interpretation of the incentives, not evidence that Beijing and Moscow have become interchangeable or that Kim can dictate terms to either. The country remains extraordinarily vulnerable to decisions made outside its borders. Yet vulnerability and bargaining power can coexist. A supplier can be economically small and strategically difficult to replace at a particular moment.
That is the starting point for understanding the North Korean economy. Its survival is neither a miracle of self-sufficiency nor proof that international restrictions have no effect. It reflects a combination of domestic production, household adaptation, coercive resource allocation, external political support and foreign earnings that extend well beyond the goods appearing in customs statistics.
The question is therefore more precise than “How does a closed country survive?” Which parts of the country are closed, which institutions can cross the boundary, who earns the foreign currency, and who absorbs the adjustment when resources run short?
The answers describe several economies operating within one state. There is an economy of strategic institutions, with privileged access to resources. There is an economy of enterprises and farms subject to official plans and obligations. There is a household economy that combines formal assignments with trading, cultivation, family networks and improvised ways of obtaining necessities. Treating them as one representative North Korean household conceals the central financial mechanism: the state can improve its access to resources while many citizens face a worsening budget constraint.
Before examining that mechanism, the numbers need to be put in their proper place. North Korea does not publish a transparent, independently auditable system of national accounts, public finances and household income statistics. The available evidence is assembled from South Korean estimates, the trade declarations of other countries, satellite observation, international surveys conducted when access was possible, market-source networks and testimony. These sources answer different questions. They cannot be combined into a single precision estimate merely because they all contain numbers.
The Bank of Korea’s national accounts are estimates made using South Korean prices and value-added ratios. KOTRA’s trade reports reconstruct merchandise flows largely from partner-country statistics. A United Nations household survey measures the conditions of the people it sampled in a particular year. A military intelligence estimate measures something else again. The dates and denominators are part of the finding, not footnotes to be discarded. [2–5]
The most dangerous mistakes are straightforward. A share of GDP is not a share of employment. Gross export receipts are not profits. Stolen cryptocurrency valued at the time of theft is not necessarily cash successfully spent by the state. A defence allocation expressed as a percentage of a government budget is not a percentage of national output. And a census conducted in 2008 cannot honestly be presented as a labour-market survey of 2026.
These distinctions do not prevent analysis. They make it possible.
North Korea’s starting position also matters. The country was not always imagined as the economically hopeless half of the peninsula. It inherited substantial industrial assets and benefited from Soviet support. The withdrawal of that support, deteriorating trading conditions and the failure of domestic economic arrangements helped transform its position. The OECD’s historical assessment describes a long deterioration followed by the growth of a hybrid system in which state, party and military control coexist with markets and private initiative. [6]
The economic shock was especially severe because industrial agriculture depends on industry. Fertilizer needs industrial inputs and energy. Irrigation needs functioning equipment and power. Machinery needs fuel and spare parts. When those links break, a country can have a large agricultural workforce and still struggle to feed its population. Sending more people into fields does not replace every missing input.
This history helps explain why “agricultural” and “self-sufficient” should never be treated as synonyms. A subsistence response may keep people alive while also pulling labour away from activities that would otherwise raise productivity. Survival can be achieved by reducing consumption, using more unpaid time and running down assets. None of those adjustments establishes that the economic system is working well.
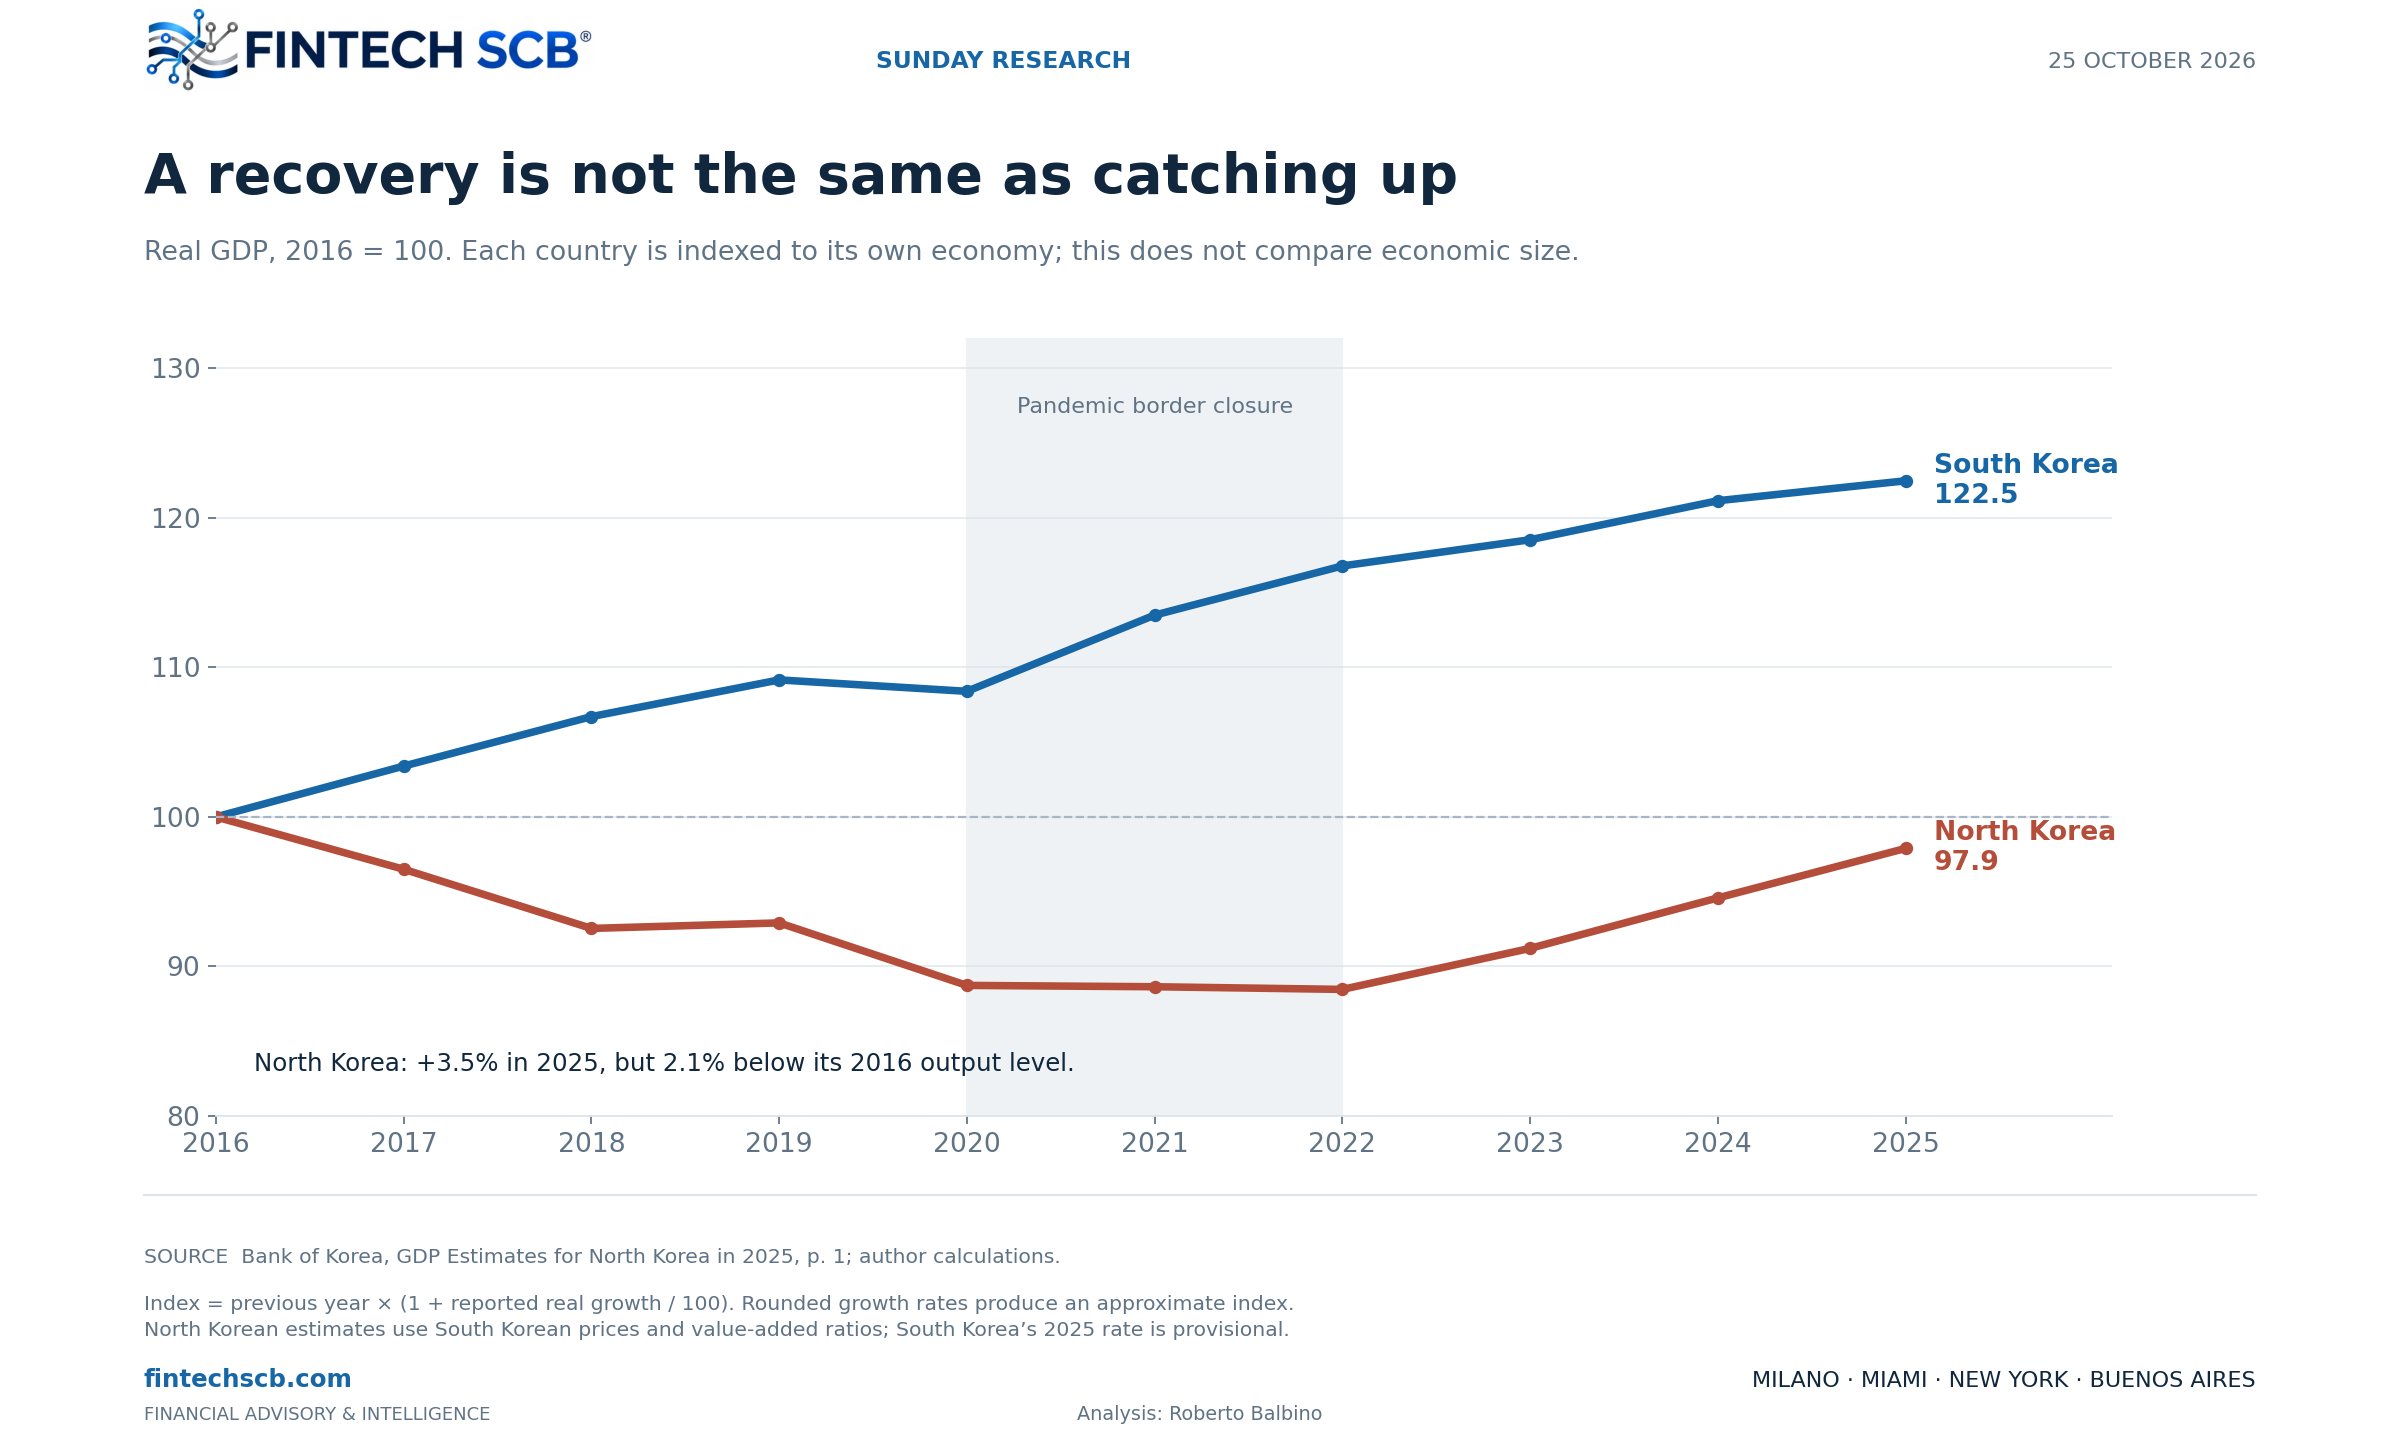
The latest growth figures are more favourable than the image of permanent collapse might suggest. The Bank of Korea estimates real GDP growth of 3.1% in 2023, 3.7% in 2024 and 3.5% in 2025. Compounding those rates produces a recovery of approximately 10.7% over three years. However, chaining the same source’s annual growth estimates from 2016 leaves 2025 output around 2.1% below the 2016 level. South Korean output rose approximately 22.5% over that interval. Chart 1 traces that divergence using approximate indices calculated from rounded growth rates. [2]
The distinction between a rebound and sustained development is essential. Reopening a supply route, increasing industrial production or putting idle capacity back to work can generate rapid growth from a depressed base. That is economically meaningful. It does not establish that productivity, household consumption, infrastructure and private investment are converging towards the standards of neighbouring countries.
Nor does a national output estimate tell us who receives the additional production. A construction programme, an increase in military-related manufacturing and an improvement in food processing can all enter measured output. Their implications for the representative household are very different. Output composition and access matter as much as the headline growth rate.
The production structure makes the difference concrete. In the BOK’s 2025 estimates, agriculture accounts for 21.2% of North Korean output and services for 29.6%. The corresponding South Korean proportions are 1.5% and 61.2%. [2]
Mining and manufacturing account for 30.1% of North Korean production and 29.9% of South Korean production. Electricity, gas and water contribute 7.4% in the North against 2.8% in the South, while construction represents 11.6% against 4.6%. The similarity of the industrial percentages is particularly revealing: a comparable share of two very different economies does not imply comparable industrial capacity.
These are nominal production shares within the BOK’s framework, not employment shares. South Korea’s denominator is gross value added at basic prices, and its 2025 figures are provisional. An industrial sector can occupy a large part of a small economy without delivering prosperity comparable to a much larger industrial system.
The composition of the recovery raises a second question. BOK estimates manufacturing growth of 6.6% and construction growth of 6.3% in 2025, while electricity, gas and water output fell 0.4%. [2] This does not establish a precise energy constraint at every factory. It does identify a reason to look beyond buildings and gross production. A new plant creates lasting economic value only if it can obtain inputs, operate reliably, maintain its equipment and deliver something that people or customers can use.
Construction is particularly easy to misread in a controlled economy. Work performed can increase measured output before the resulting asset produces a useful stream of services. The investment test concerns that future stream, maintenance requirements and the resources displaced during construction. A completed building and a productive capital asset are not interchangeable observations.
The Bank of Korea’s North–South comparison, shown in Chart 2, places 2025 GNI per person at 1.873 million South Korean won in the North and 52.570 million in the South, a ratio of roughly 28.1 to one. These are national-account averages under the BOK’s valuation method, not average salaries, median incomes or purchasing-power-adjusted living standards. Converting the North Korean figure into dollars and placing it beside unrelated international income series would create a false appearance of comparability. [2]
The ratio indicates the scale of economic divergence within that statistical framework. It does not tell us what a nurse in a provincial town receives, what a market trader earns, or how much an official’s access to housing and scarce goods is worth. Those questions require household evidence that is much harder to obtain.
In an ordinary market economy, an analyst might begin with employment, wages, taxes and transfers. In North Korea, formal employment status can be a poor guide to the resources on which a family actually lives. A nominal job can impose attendance and other obligations while yielding inadequate cash income. The household’s practical means of support can lie elsewhere.
The last detailed census benchmark used here is the 2008 census, whose key findings were published with UNFPA support. It reported about 12.2 million employed civilians, approximately 70% of the civilian population aged sixteen and above. Its sectoral breakdown remains useful as a dated structural benchmark. It is not a current estimate. [5]
Agriculture, forestry and fishing accounted for approximately 36% of employed civilians. Manufacturing employed another 24%, mining and quarrying 6%, and public administration 6%. The remaining civilian sectors made up approximately 28%, calculated as the residual of those rounded shares. Chart 3 presents that historical distribution.
Those percentages refer to employed civilians and exclude the armed forces. “Public administration” is also not equivalent to all state employment: a worker in a state factory belongs to manufacturing, while someone on a cooperative farm belongs to agriculture. Describing the remaining workforce as private-sector employees would therefore be wrong.
For military scale, Japan’s 2024 defence white paper, drawing on the Military Balance and other sources, cited approximately 1.28 million North Korean personnel. Against the population figure used in the same comparison, that is about 4.9% of residents: roughly one in twenty people. It is an estimate of active military personnel, not an employment share that can be combined with the civilian census percentages. Reservists also overlap with civilian life and cannot simply be stacked on top of workers as another mutually exclusive category. [7]
The economic cost extends beyond the number of people in uniform. Time spent in prolonged military service has an opportunity cost in education, civilian work and family life. Military personnel may also perform construction and agricultural labour. A uniform describes an institution’s claim over a person’s time; it does not fully describe the economic activity that person performs.
The UN human rights office’s 2024 report on forced labour documents compulsory work across state employment, military service, mobilisations, detention and overseas assignments. Its testimony also describes payments associated with avoiding work obligations and earning a livelihood in markets. Married women have often had greater scope than men to leave state-assigned jobs and engage in small-scale trading, making their earnings important to household survival. These accounts illuminate mechanisms; they should not be mistaken for a representative 2026 wage survey. [8]
A family’s effective budget can consequently include several components: earnings from selling goods or services; produce grown for household use; food or other benefits distributed through a workplace; assistance from relatives; and costs associated with permissions, obligations and informal payments. Cash wages alone may explain very little.
The financial interpretation is uncomfortable. A household may use income earned in a market to sustain a member’s formal relationship with a workplace that does not adequately support that household. In such circumstances, private initiative helps maintain the labour system surrounding it. The existence of markets does not automatically mean that the state has relinquished control.
Nor does market activity automatically mean secure private property. The OECD describes the emergence of donju, often translated as “masters of money”: people whose accumulated resources financed trading, transport, lending and construction, including activity conducted within state institutions. Some property development arrangements remunerated investors through building-use rights rather than ordinary ownership titles. [6]
That distinction changes the meaning of an investment return. A commercially successful project may still depend on continued official permission, access to a patron, or an agreement that cannot be enforced independently against the state. The financial risk includes the possibility that the rules governing the asset will change after the capital has been committed.
North Korea’s 2009 currency reform provides a concrete historical example. Exchange restrictions and limits on the conversion of existing cash damaged private holdings. Subsequent research on dollarisation links that experience to household use of foreign currencies as stores of value and means of payment. The legacy is a problem of monetary credibility: people can be compelled to use a national currency for some purposes while preferring another currency to preserve their savings. [9]
This becomes especially important when state access to foreign currency and household access to it diverge.
A June 2026 Korea Development Institute study by Nam Jinwook examines precisely that tension in 2025. Its table of annual-average market exchange rates reports 13,120 North Korean won per dollar in 2024 and 28,966 in 2025 using Daily NK observations. The AsiaPress series shows the same broad deterioration, with both trajectories presented in Chart 4. KDI also records episodes when rice prices exceeded 20,000 won per kilogram, compared with a much earlier period of relative stability around 5,000. The rice figures describe different periods and price conditions, not two comparable annual averages. [10]
There is a useful technical point in the exchange-rate arithmetic. A rise of 120.8% in the number of won needed to buy a dollar does not mean the won lost 120.8% of its value. Taking the reciprocal, its dollar value fell approximately 54.7% between the two annual averages in the Daily NK series. Confusing those calculations is a common way of making a currency crisis sound even more dramatic than the evidence warrants.
The underlying distributional issue needs no exaggeration. A household with foreign-currency savings, a household earning fixed nominal won and an institution controlling export proceeds face different consequences from the same exchange-rate movement. National foreign-currency earnings can rise without making foreign currency readily available to ordinary traders. Domestic purchasing power depends on the channels through which those earnings enter the economy.
KDI argues that tighter control of trade and constraints on private foreign-currency channels help explain the disconnect. That is an interpretation supported by market observations, not a complete accounting of every transaction. But it directly challenges the comforting assumption that a recovery in external trade must automatically stabilise household markets. [10]
A sovereign can become better able to import strategic inputs while citizens become less able to buy imported necessities. There is no accounting contradiction. They are different buyers with different access rights and different sources of income.
To understand the external side, start with the goods we can see. The latest BOK release reports approximately $0.47 billion of North Korean merchandise exports and $2.66 billion of imports in 2025, excluding inter-Korean goods movements. That implies a recorded goods gap of about $2.19 billion. Chart 5 places those flows in their longer historical context. KOTRA’s public summary puts China’s share of recorded trade at 98.2%. [2,4]
That concentration is striking. It is also easily misused. The figure describes the coverage of a trade dataset, not the percentage of all resources entering the country that originate in China. The detailed 2024 KOTRA report explicitly excluded Russia because official statistics were unavailable. Undisclosed arms transactions, military services, transfers in kind and covert activities cannot be assumed to appear in customs data. [3]
This is why greater strategic dependence on Russia can coexist with an overwhelmingly Chinese share of recorded commercial trade. One statement concerns relationships that are poorly measured. The other concerns a series dominated by the flows for which statistics exist.
The detailed 2024 partner data also answer the question of whether North Korea trades only with China, Russia and Iran. The recorded network extends to other countries, although the scale outside China is tiny. These bilateral figures describe 2024, the period for which the detailed report was checked. [3]
China accounted for approximately $341.8 million of North Korean exports and $2.299 billion of imports in 2024. Argentina was the next-largest recorded partner, with about $15.1 million in total trade, overwhelmingly North Korean imports. Vietnam followed at $12.9 million, including approximately $4.9 million in North Korean exports and $8.0 million in imports. Trade with the Netherlands totalled approximately $8.2 million, again dominated by North Korean imports.
Nigeria, India and Austria recorded roughly $4.5 million, $3.5 million and $2.7 million respectively in two-way trade. Indonesia, Mozambique and Senegal also appeared among the top ten, each below $1 million. These are small amounts in international commerce, but they establish that the recorded trading network extends beyond North Korea’s principal strategic partners.
These are mirror-trade records. They do not establish political endorsement by a trading partner, identify the ultimate beneficiary of every shipment, or determine whether each transaction complied with sanctions. The latest 2025 KOTRA summary shows a changed ranking, with Vietnam and Tanzania following China and Zimbabwe and Laos entering the top ten. That variation should also discourage the idea of a fixed, self-contained three-country trading bloc. [3,4]
China, Russia and Iran nevertheless belong in different analytical categories. China supplies the dominant commercial connection. Russia buys military capabilities and provides forms of support whose strategic significance exceeds their visibility in trade tables. Iran has a history of missile-related links with North Korea, but that is not evidence that it finances a large share of North Korea’s ordinary import needs.
The UN Panel of Experts’ 2021 report recorded a member-state allegation of renewed long-range missile cooperation and included Iran’s rejection of the information supplied. The history of missile connections is relevant; a quantified Iranian subsidy to North Korea’s economy cannot be inferred from it. Nor does missile cooperation prove the transfer of a complete nuclear weapon. [11]
The goods crossing the Chinese border offer a less familiar picture than missiles and coal. In KOTRA’s 2024 China table, the category covering wigs, prepared feathers and related articles accounted for approximately $189.4 million of North Korean exports, over half the recorded exports to China. Ores, iron and steel, mineral fuels and watch-related goods were also prominent. Imports included fuels, plastics, textile inputs and fats and oils. Chart 6 shows the composition of these recorded flows. [3]
The beauty-products connection is more than an anecdote. It shows how labour in a severely restricted economy can participate in an international production chain. The foreign consumer may see a finished product several transactions downstream, while the production arrangement rests on access to cheap labour and imported materials.
But the accounting must be handled correctly. The export value of a wig is not the North Korean wage embedded in it, the profit of the producer, or the amount retained by the government. Imported hair and other materials are inputs. Gross export receipts need to be distinguished from domestic value added. Simply subtracting the imports and exports of a broad customs chapter would also be unreliable because product composition, inventories and timing differ.
The same discipline applies to mineral wealth. A deposit in the ground is not spendable foreign currency. Commercial value depends on recovery costs, electricity, machinery, transport, processing, market access and enforceable rights. A spectacular estimate of underground resources does not become a sovereign asset valuation merely by multiplying tonnes by a commodity price. Sanctions and political risk further complicate the conversion of geological resources into income.
The recorded import gap creates another temptation: assign the entire difference to Chinese aid. That would be a balance-of-payments error. Goods exports and imports are only part of the external accounts. Services, income, transfers, credit, changes in assets and liabilities, and unrecorded flows all matter. There is no sufficiently transparent consolidated set of North Korean accounts that allows us to close the gap with confidence.
The useful question is which mechanisms can supply purchasing power or goods outside the visible merchandise account. Russia’s war against Ukraine has made one mechanism especially important.
The Multilateral Sanctions Monitoring Team’s May 2025 report describes extensive North Korean ammunition transfers and the deployment of more than 11,000 troops in late 2024. One participating state assessed that Russian vessels delivered as many as nine million rounds of mixed artillery and multiple-rocket-launcher ammunition in 2024. The report also discusses Russian supplies of petroleum, military equipment, training and financial support mechanisms. These are attributed assessments, not audited commercial invoices. MSMT is a group of participating governments, distinct from the former UN Panel of Experts. [12]
The financial significance begins with scarcity. A production capability that appears technologically unremarkable in peacetime can become highly valuable to a buyer engaged in a prolonged war. The value of compatible ammunition depends on the buyer’s immediate requirement, alternative suppliers, production lead times and inventories. It cannot be inferred solely from the sophistication of the weapon.
North Korea therefore gains a kind of demand that conventional development analysis can miss. It need not sell a competitive civilian product to millions of foreign customers. It can sell military usefulness to a strategically motivated buyer.
The return may also take several forms. Cash is one possibility. Fuel, food, equipment, technical assistance, training or settlement through special arrangements can also relieve resource constraints. A delivery of oil can support the state without appearing as dollars available for civilian households. Information and technical assistance may have strategic value that cannot be priced reliably from public evidence.
This is why multiplying an estimated shell count by an assumed retail price is not a credible revenue model. The ammunition mix, quality, timing, delivery terms, stock origin and consideration received are not fully known. A range built on several unverified assumptions can remain speculative even when its endpoints are expressed with impressive precision.
There is a further distinction between selling current production and selling an accumulated stock. Exports of newly produced goods can be associated with current industrial output. Disposal of existing inventories converts a previously accumulated asset into external purchasing power. Both can support imports, but they have different implications for current GDP and future productive capacity. We do not have the information to allocate all military transfers between these categories.
A government can consequently enjoy a temporary improvement in external resources without having created a durable civilian growth model. Whether the proceeds are used for productive investment, replacement of depleted stocks, elite consumption or further military development determines the longer-term effect.
Labour abroad provides another source of income, again with a fundamental distinction between what is earned and what the worker receives. MSMT’s September 2026 report estimated that overseas labour generated $450 million to $800 million for the North Korean government in 2025, with most of that revenue attributed to IT workers. It estimated between 35,600 and 101,280 workers across at least seventeen countries, concentrated in China and Russia. The breadth of that range is itself a warning against false precision. [13]
The same report describes confiscation of much of workers’ pay. Economically, this resembles an extremely high effective extraction rate from labour income, backed by coercion rather than an ordinary voluntary employment relationship. The worker’s gross foreign earnings, net take-home pay and the state’s receipts are three different figures.
Overseas labour can be valuable to the state because it earns income at foreign wage levels while workers and their families remain subject to domestic controls. Yet it is not costless revenue. The arrangement carries human costs, exposes workers to exploitation and diverts part of the workforce from domestic activity. That coercion is central to the model, not a detail to be omitted from a discussion of margins.
IT work adds another complication: the customer may be an ordinary foreign business purchasing apparently ordinary services. The location of the customer does not reveal the ultimate origin of the labour, and the identity of an intermediary may not identify the final beneficiary. North Korea’s external economy can therefore reach well beyond countries that openly maintain close political relations with it. [13]
Cyber theft is a separate activity. Chainalysis’s assessment published on 18 December 2025 attributed at least $2.02 billion of cryptocurrency theft that year to North Korean hackers. The FBI attributed approximately $1.5 billion stolen from Bybit in February 2025 to North Korea. The Bybit event is part of the broader theft picture, not another sum to add on top. [14,15]
Chart 7 puts merchandise exports, estimated overseas-labour revenue and attributed cryptocurrency theft alongside one another. Their scale is financially consequential, but they measure different things and cannot be summed into a revenue total. Valuation at the time of theft is not the same as net realised proceeds. Asset prices can move; assets can be frozen or recovered; intermediaries and conversion can impose costs. Nor is theft itself newly produced domestic output that can simply be added to GDP.
Equally, the overseas-labour estimate already includes IT workers. Adding a separate IT-worker estimate to it would double count. Adding goods exports, stolen asset values and estimates of military receipts into a single “North Korean revenue” number would mix different accounting concepts and incomplete coverage.
The institutional pattern matters for understanding how the system survives. Selected organisations can access global customers, digital infrastructure and financial assets while the wider population remains tightly restricted. The regime does not need to provide ordinary citizens with unrestricted internet access in order for specialised units to exploit an internationally connected economy.
For financial institutions, this changes the perimeter of exposure. North Korean risk is not confined to a payment bearing a North Korean address. It can arise through contractor relationships, ownership structures, cybersecurity failures and the provenance of digital assets. Geographic screening remains relevant, but an apparently innocuous location cannot substitute for understanding who performs the work, controls the counterparty or benefits from a transaction.
The discussion of military finance should now become clearer. North Korea does not fund its armed forces only through a transparent budget funded by conventional taxes. It can direct domestic production, allocate labour, prioritise access to fuel and electricity, extract resources through state institutions and obtain external support in cash or in kind. Measuring only the visible budget misses part of that economic burden.
Japan’s 2024 defence white paper recorded North Korea’s announced defence allocation of 15.9% of its government budget, while warning that it was thought to represent only part of actual defence spending. That figure must not be relabelled as 15.9% of GDP. The publicly available evidence does not support an independently verified consolidated military bill. [7]
There is also a difference between the cash cost of a military programme and its cost to society. If workers cannot freely bargain over wages, low payroll expense does not prove that their labour is economically cheap. If a factory receives preferential electricity, the cost includes what other producers and households cannot do with that electricity. If transport capacity is reserved for strategic use, the civilian economy bears part of the adjustment.
An apparently low-cost military system can therefore be expensive in the currency that matters most to the population: foregone consumption, health, productive opportunity and time. These costs may not appear in a budget line. They still constrain development.
That helps answer the apparent paradox of nuclear weapons in a poor country. Poverty in the average household does not mean the state has no engineers, industrial knowledge or ability to concentrate resources. Advanced capability can be developed within a narrow set of institutions while much of the economy remains inefficient and materially deprived.
The nuclear programme also accumulated over decades. Congressional Research Service histories trace its early foundations to cooperation with the Soviet Union beginning in the late 1950s, followed by the development of indigenous capabilities and foreign procurement. Later assistance associated with Pakistan’s A.Q. Khan network contributed to the uranium-enrichment pathway. That history does not reduce to one foreign government handing over a complete bomb. [16]
The chronology helps separate the contributors. Soviet cooperation established an early research foundation; North Korea subsequently developed its own facilities and expertise. It joined the Nuclear Non-Proliferation Treaty in 1985 under Soviet pressure, but safeguards inspections began only in 1992. The 1994 Agreed Framework froze the plutonium programme under monitoring in exchange for assistance. The confrontation over a suspected clandestine enrichment programme contributed to that arrangement’s breakdown in 2002. The Khan network belongs to the history of the enrichment route, rather than being the sole explanation for decades of North Korean nuclear development. [16]
The institutional memory, trained personnel and facilities built over successive periods matter. So does the capacity to preserve a programme through changes in external support. The economic comparison is with a long accumulation of strategic capital, not the annual disposable income of an ordinary family.
The political history includes negotiated freezes and their breakdown, the first nuclear test in 2006 and five further tests through September 2017. The sequence is a reminder that diplomacy has sometimes altered the pace or operation of parts of the programme without resolving the underlying security and political incentives. It would be inaccurate to describe every past agreement as either a complete solution or wholly without effect. [16,17]
SIPRI estimated that North Korea had assembled around sixty nuclear warheads by January 2026 and possessed fissile material potentially sufficient for at least ninety in total. These are estimates, not a verified inventory. The two numbers cannot be added together. In September 2026, the IAEA continued to report indications of activity and expansion at North Korean nuclear facilities. Its monitoring does not provide the same certainty as unrestricted on-site verification. [18,19]
The strategic value to the leadership includes deterrence and bargaining power. But that does not make the programme economically self-financing, nor does it make it a source of welfare for citizens. A capability can strengthen the survival prospects of a political leadership while imposing substantial costs and risks on the society it governs.
Nuclear weapons also change the interpretation of external support. A neighbour concerned about instability may attach a high cost to collapse, uncontrolled escalation or a regional conflict. That concern can weaken its willingness to apply pressure to the point of destabilisation. This is an incentive problem: the coercive value of a threat to withdraw support depends partly on whether carrying out the threat would also damage the country making it.
Beijing and Moscow need not share identical objectives for Pyongyang to benefit from that constraint. China has reasons to value stability along its border. Russia currently derives military usefulness from North Korean cooperation. The opening of new crossings matters because it can make those relationships easier to sustain in material terms. It does not prove that North Korea has escaped dependency; it suggests that it has gained additional ways to manage it.
The household economy brings the analysis back to food.
Agricultural output, food availability and adequate nutrition are related but different. A harvest estimate tells us something about production. It does not establish who can obtain the crop, the purchasing power of households, the diversity of their diets or the quality of water and sanitation. National food supply can improve while vulnerable groups continue to face severe deprivation.
The World Food Programme’s country page cites an estimate of 10.7 million undernourished people, more than 40% of the population, drawing on the 2022 State of Food Security and Nutrition in the World report. That is a dated estimate, not a headcount taken in October 2026. It remains relevant to the scale of the problem, but it should not be presented as newly observed evidence. [20]
There is also evidence of past improvement, which a serious account should acknowledge. UNICEF’s analysis of household survey data reported a decline in childhood stunting from roughly 32% in 2009 to 19% in 2017. The same 2017 evidence showed marked differences by household wealth, with stunting around 27% among the lowest wealth group and 14% among the highest group used in the analysis. Those groups are based on assets, not a direct measurement of income. Chart 8 shows both the historical improvement and the inequalities remaining in 2017. [21]
The observation undermines two simplistic narratives at once. North Korea is not a place in which every social indicator must deteriorate every year. Nor is a national improvement proof that deprivation has become evenly distributed or politically irrelevant. Progress and exclusion can occur together.
The most recent FAO country brief available for this analysis, dated 4 September 2026, described generally favourable growing conditions for the main food crops and good vegetation conditions in much of the country. That is evidence about crop prospects based in part on remote sensing. It is not proof that every household will receive an adequate diet after the harvest. [22]
This distinction is especially important when discussing the much-repeated story of parasites in a North Korean defector. The underlying event is real. In November 2017, Reuters reported that surgeons treating a soldier who had crossed into South Korea found numerous intestinal parasites, including one measured at twenty-seven centimetres. It was a report about a particular severely injured patient. It was not a national survey of defectors or evidence that every North Korean had the same condition. [23]
Reuters also reported experts’ concern about the use of human waste as fertilizer when chemical inputs and animal manure were scarce. The report recalled Kim’s 2014 encouragement to use human and animal waste and organic compost. This is the documented agricultural connection behind the anecdote; it should not be replaced by an invented explanation about repeatedly using one cow. [23]
The explanation involving repeated fertilisation by “the same cow” is unsupported. For soil-transmitted intestinal worms, the World Health Organization identifies contamination of soil by eggs in human faeces as a transmission route where sanitation is inadequate. The relevant concern includes untreated faecal contamination of soil, water and food. The repeated identity of an animal is not the mechanism. Nor should the story be turned into a claim that all properly treated organic fertilizer is inherently unsafe. [24]
The economic significance is deeper than the shocking image. Constraints on agricultural inputs can interact with inadequate sanitation and unsafe handling of waste. Illness then imposes costs on nutrition, learning, work and care. The burden can compound across a household even when the initial response to scarcity appears to save money or replace a missing input.
One should not infer the prevalence of infection from a single patient. The legitimate inference is that food security cannot be separated from public health infrastructure. Grain tonnage is an incomplete measure of the resources needed for a healthy population.
This is also where the distribution of the state’s spending priorities becomes tangible. A military programme has concentrated institutions able to demand resources. A household’s need for clean water, a functioning clinic or a diverse diet may be dispersed and less able to influence allocation. The social return to an investment and its value to the leadership are not necessarily the same.
International sanctions complicate this economy, but they do not provide a complete explanation for it. Restrictions can obstruct trade, raise transaction costs and limit access to equipment and finance. Domestic policy can separately restrict markets, movement and the use of earnings. Pandemic border controls created another shock. External support can offset some constraints while leaving others intact. Assigning every hardship to one cause would erase the interaction between them.
The sanctions system is also not a simple prohibition on every exchange with every North Korean. The UN framework contains humanitarian exemptions and a mechanism for authorising assistance. The existence of an exemption, however, does not by itself supply a willing bank, a transport route, operational access or the ability to monitor distribution. Formal permission and practical delivery capacity are different requirements. [25]
Likewise, the discovery of ongoing trade does not prove sanctions are meaningless. Restrictions can reduce income or raise costs without bringing about a change in government or policy. Conversely, pressure can be weakened when important governments provide alternative support or decline to enforce agreed limits. Russia’s 2024 veto ended renewal of the UN Panel of Experts’ mandate; it did not itself repeal the underlying Security Council sanctions. MSMT emerged in that monitoring gap. [12,26]
The appropriate economic questions are therefore specific. Which transactions have become more costly? Which revenues have been displaced or replaced? Which institutions retain access? What burden falls on ordinary people? And has the leadership’s incentive to change policy become stronger or weaker?
There is no single indicator that answers all five questions.
The same caution applies to the possibility of future development. Better roads and bridges create useful capacity. They do not establish a credible investment regime. A manufacturer considering a long-lived project would need predictable access to inputs and power, the ability to employ people under lawful conditions, enforceable agreements, reliable payment arrangements and a lawful route to market. Those requirements extend far beyond the existence of transport infrastructure.
For North Korea itself, durable development would require more than extracting additional resources from existing relationships. It would require sustained improvements in productivity and infrastructure, a healthier workforce and greater confidence that productive initiative will retain a meaningful share of its returns. Without that confidence, households have reasons to protect liquid assets, shorten planning horizons and avoid commitments that can be appropriated or rendered unusable by a policy change.
There is a geopolitical obstacle as well as an economic one. If external earnings are concentrated in military usefulness and politically controlled channels, the leadership may face less immediate pressure to create the conditions for broad civilian prosperity. This is a possible effect of the current incentives, not a forecast that reform has become impossible. It explains why additional resources can reinforce an existing allocation system rather than transform it.
Three future paths are worth watching, without assigning them invented probabilities. If demand for military support remains strong and relations with China remain functional, the state may continue to secure strategic inputs while tightly managing the civilian economy. If the war-related windfall weakens, China’s relative importance may rise again and foreign-currency constraints could become more acute. A more substantial commercial opening would require observable changes in market access, property and payment arrangements, and the treatment of workers—not merely another diplomatic visit.
Each path has different implications for households. Under the first, national production and state resources could improve without proportionate gains in consumption. Under the second, adjustment might again be imposed through reduced imports, higher prices or stronger extraction. Under the third, benefits would depend on who receives permission to participate and whether the rules are durable enough to support productive investment.
The evidence to watch is correspondingly practical: the composition of imports; deliveries of agricultural inputs; market prices and exchange rates across several locations; signs of industrial and transport activity; the terms and scale of Russian cooperation; independent access for humanitarian organisations; and credible household information. No one series should be allowed to stand in for all the others.
For readers accustomed to analysing companies or sovereign borrowers, North Korea poses a useful discipline. There is no consolidated public financial statement that can be reconstructed reliably by adding headlines. But there is an identifiable system for obtaining and allocating resources. Its defining feature is the separation between the leadership’s financing needs and the population’s freedom to earn, consume and accumulate assets.
The bridge in Dandong belongs in that system. It can support legitimate goods trade, strategic relationships and the state’s ability to obtain resources. Whether it supports a better life for ordinary North Koreans depends on how those resources move after they cross the river.
The achievement that matters to the leadership is continued control. The achievement that matters to a household is the ability to live more securely and plan beyond the next shortage. Economic growth may contribute to both, but the evidence gives us no reason to assume that it must.
North Korea survives because it is connected selectively, allocates resources coercively and has citizens who continually adapt to constraints. Its new external opportunities may make that system more resilient. The test of development is whether they also make the people less vulnerable.
---
Source notes and methods
This analysis uses information available on 25 October 2026. The argument about incentives and distribution is the author’s analysis. Statistics, allegations and estimates are attributed below. No 2026 full-year GDP, household-income or trade estimate has been invented. The underlying datasets and chart calculations accompany the article.
[1] Financial Times, Daniel Tudor and Edward White, “North Korea’s Kim Jong Un crosses new China border bridge to reaffirm ties”, 24 October 2026. https://www.ft.com/content/fd106d25-3abf-4729-be26-683d1d115d2e
[2] Bank of Korea, “Gross Domestic Product Estimates for North Korea in 2025”, 31 July 2026, especially pp. 1–5. Valuation uses South Korean prices and value-added ratios. North–South GNI comparison is presented in the source’s own framework; it is not a PPP comparison. The 2016–2025 output index is the author’s compounding of rounded annual growth rates. https://www.bok.or.kr/fileSrc/eng/e18f4b90f3484081af479761031ba837/1/e2d4529774384a40a00c6ca5c1c13b52.pdf
[3] KOTRA, “2024 North Korea Foreign Trade Trends”, July 2025. Methodology: pp. 1–2; partner table: p. 12; China product tables: pp. 15–16; historical trade annex: p. 40. Values originally in US$ thousands have been converted to millions or billions. The report explicitly excludes Russia for lack of official 2024 statistics. https://dl.kotra.or.kr/pyxis-api/2/digital-files/a2a08dc0-04d9-447e-8df4-24caead37337
[4] KOTRA, “2025 North Korea Foreign Trade Trends”, public report summary, 28 July 2026. Used for China’s 98.2% share and the updated country ranking. Detailed product and country tables in this article deliberately retain the fully checked 2024 reference period. https://dream.kotra.or.kr/kotranews/cms/indReport/actionIndReportDetail.do?CONTENTS_NO=1&MENU_ID=280&pRptNo=14262
[5] “2008 Census of Population of DPRK: Key Findings”, UNFPA-hosted release, p. 3. The employment shares are rounded; the 28% “other” category is a calculated residual. These statistics concern civilians and cannot be interpreted as current employment shares. https://aa.unfpa.org/sites/default/files/jahia-news/documents/news/2010/dprk08_censuskeyfinds.pdf
[6] OECD Economics Department, “North Korea: The Last Transition Economy?”, Working Paper No. 1607, 2020, including the historical assessment and the discussion of donju on p. 32. Used for historical institutional context, not as a source of 2026 household conditions. https://www.oecd.org/content/dam/oecd/en/publications/reports/2020/04/north-korea-the-last-transition-economy_f0e702c1/82dee315-en.pdf
[7] Japan Ministry of Defense, Defense of Japan 2024. The regional comparison cites approximately 1.28 million North Korean military personnel and a population of 26.19 million; their ratio is an author calculation. The Japanese country chapter distinguishes the announced 15.9% budget allocation from actual defence spending. https://www.mod.go.jp/en/publ/w_paper/wp2024/DOJ2024_EN_Full.pdf ; https://www.mod.go.jp/j/press/wp/wp2024/html/n130401000.html
[8] Office of the UN High Commissioner for Human Rights, “Forced Labour in the Democratic People’s Republic of Korea”, 16 July 2024. Testimony and institutional findings do not constitute a representative current household-income sample. https://seoul.ohchr.org/sites/default/files/2024-07/ENGLISH_OHCHR%20Report%20-%20Labour%20-%20DPRK%2016%20July%202024.pdf
[9] Research on dollarisation and the 2009 currency reform: “Dollarization in North Korea: Evidence from a Survey of North Korean Refugees”, 2017; and “Dollarization, Seigniorage, and Prices: The Case of North Korea”, Emerging Markets Finance and Trade, 2017. Refugee samples and historical accounts have limits of coverage and representativeness. https://www.kci.go.kr/kciportal/landing/article.kci?arti_id=ART002211233 ; https://www.tandfonline.com/doi/abs/10.1080/1540496X.2017.1344833
[10] Nam Jinwook, Korea Development Institute, “Assessment and Outlook for North Korea’s Market Exchange Rates and Prices in 2025”, The DPRK Economic Outlook 2025/2026, 19 June 2026. Table 2-1 on p. 53 reports the annual-average Daily NK and AsiaPress series. Rice-price peaks are not used as annual averages. The exchange-rate calculation compares reciprocal rates; it is not a calculation of a national real wage or CPI. https://m.kdi.re.kr/eng/research/dprkView?art_no=3796
[11] UN Panel of Experts, S/2021/211, paragraph 25 and Annex 19. The Iran-related material includes an allegation supplied by a member state and Iran’s response. https://digitallibrary.un.org/record/3906140/files/S_2021_211-EN.pdf
[12] Multilateral Sanctions Monitoring Team, “Unlawful Military Cooperation including Arms Transfers between North Korea and Russia”, 29 May 2025. Ammunition and personnel figures are attributed estimates. MSMT is not the UN Panel of Experts. No speculative monetary valuation of the transfers is included. https://msmt.info/view/save/2025/05/29/1085cade-a4b1-4405-94c0-7c980c24fd21-Unlawful_Military_Cooperation_including_Arms_Transfers_between_North_Korea_and_Russia_%28MSMT_2025_1%29.pdf
[13] MSMT, “The DPRK’s Use of Overseas Labour to Violate and Evade UN Sanctions”, 16 September 2026, especially the overview on p. 9. Its government-revenue estimate includes IT workers; no separate IT-worker estimate has been added. https://msmt.info/view/save/2026/09/16/1c62aba4-000e-4079-90fb-971b7fd7ad2e-The_DPRK_Use_of_Overseas_Labour_to_Violate_and_Evade_UN_Sanctions.pdf
[14] Chainalysis, “North Korea Drives Record $2 Billion Crypto Theft Year, Pushing All-Time Total to $6.75 Billion”, published 18 December 2025. Private-sector attribution estimate; gross stolen asset value, not audited cash receipts. The 2025 figure reflects the assessment as published on that date and can be revised. https://www.chainalysis.com/blog/crypto-hacking-stolen-funds-2026/
[15] FBI, “North Korea Responsible for $1.5 Billion Bybit Hack”, February 2025. Used for the specific attribution, not as an additional amount beyond the broader theft estimate. https://www.fbi.gov/investigate/cyber/alerts/2025/north-korea-responsible-for-1-5-billion-bybit-hack
[16] Congressional Research Service, “North Korea’s Nuclear Weapons: Technical Issues”, RL34256, historical report dated 3 April 2013. Used only for the programme’s earlier development, Soviet cooperation, negotiated freezes and the Khan network. https://www.congress.gov/crs_external_products/RL/PDF/RL34256/RL34256.30.pdf ; accessible text: https://www.everycrsreport.com/reports/RL34256.html
[17] Congressional Research Service, “North Korea’s Nuclear Weapons and Missile Programs”, IF10472, updated October 2026; IAEA chronology. https://www.everycrsreport.com/reports/IF10472.html ; https://www.iaea.org/newscenter/focus/dprk/chronology-of-key-events
[18] SIPRI Yearbook 2026, “World Nuclear Forces”. January 2026 stockpile and fissile-material estimates are separate concepts. Approximately sixty assembled warheads and material potentially sufficient for at least ninety do not mean 150 warheads. https://www.sipri.org/sites/default/files/YB26%2008%20World%20Nuclear%20Forces.pdf
[19] IAEA Director General’s introductory statement to the Board of Governors, 7 September 2026, DPRK paragraphs. Indications of activity must be distinguished from direct verification of a complete arsenal. https://www.iaea.org/newscenter/statements/iaea-director-generals-introductory-statement-to-the-board-of-governors-7-september-2026
[20] World Food Programme, DPRK country page. The 10.7 million undernourishment estimate is explicitly linked to SOFI 2022; it is not a 2026 survey. https://www.wfp.org/countries/democratic-peoples-republic-korea
[21] UNICEF and DPRK Central Bureau of Statistics, further analysis of MICS 2017, “Sanitation, Water, Diarrhoea and Nutrition”, particularly Tables 16 and 18. The chart uses rounded published figures. The 2012 observation comes from the national nutrition survey; 2009 and 2017 from MICS. https://www.unicef.org/dprk/sites/unicef.org.dprk/files/2019-11/4.%20Data%20Mining%20Report.pdf
[22] FAO GIEWS, DPRK country brief, reference date 4 September 2026. The web page is updated over time; the date refers to the edition consulted. Crop prospects are not household nutrition measurements. https://www.fao.org/giews/countrybrief/country.jsp?code=PRK
[23] Reuters, “Defector’s Condition Indicates Serious Health Issues in North Korea”, 19 November 2017, published by Voice of America. A single clinical case, not a national prevalence estimate. https://www.voanews.com/a/north-korean-defector-health-hygiene/4125169.html
[24] World Health Organization, “Soil-transmitted helminth infections”. Used to explain the transmission mechanism, not to diagnose a population from an anecdote. https://www.who.int/news-room/fact-sheets/detail/soil-transmitted-helminth-infections
[25] UN Security Council 1718 Committee, humanitarian exemption mechanism. https://main.un.org/securitycouncil/en/sanctions/1718/exemptions-measures/humanitarian-exemption-requests
[26] Japan Ministry of Foreign Affairs, Diplomatic Bluebook 2025, Korean Peninsula section, on Russia’s March 2024 veto; MSMT’s formation statement. https://www.mofa.go.jp/policy/other/bluebook/2025/en_html/chapter2/c020203.html ; https://msmt.info/Publications/detail/Press/4198
The eight accompanying charts are original visualisations of the cited data. The accompanying CSV files preserve units, years and source identifiers. Figures are rounded for readability. No chart combines current GDP shares, the 2008 civilian workforce and later military estimates into a single population breakdown. No chart sums merchandise exports, theft and overseas-labour receipts into GDP or a claimed total state revenue.
FINTECH SCB — FINANCIAL ADVISORY & INTELLIGENCE
fintechscb.com · MILANO · MIAMI · NEW YORK · BUENOS AIRES
Originally published on Substack.
Segui Roberto Balbino su Substack