
PASSIVE INCOME, ACTIVE ILLUSIONS
From laundromats and self-service dog washes to rental properties, vending machines, digital products and investment portfolios: what the evidence actually says about buying financial freedom.
The most expensive word in small-business marketing may be “passive”.
Attach it to a laundromat, a vending machine, a holiday apartment or an online store, and an ordinary commercial activity becomes something much more seductive: a way to escape dependence on wages without assuming the daily responsibilities of running a business.
The attraction is understandable. People facing expensive housing, uncertain employment and pressure on household budgets are looking for greater financial security. They want income that continues when they stop working. They want a reserve against redundancy, illness or retirement. Some simply want their evenings and weekends back.
The danger begins when that legitimate aspiration becomes a sales argument that conceals how the income is actually produced.
A machine can accept a payment automatically. A platform can process an order while its owner sleeps. A tenant can pay rent by standing instruction. None of these facts establishes that the underlying investment generates an adequate return after maintenance, financing, replacement costs and the market value of the owner’s work.
The Wall Street Journal’s reporting on people who bought laundromats after encountering easy-money narratives online offers a useful starting point. It describes the distance between the business presented on social media and the business experienced by its owners: repairs, customers, security, staffing and operating problems.
The broader question extends far beyond laundromats.
What exactly are people buying when they purchase “passive income”? A financial asset? A small business? A second job? A claim on a platform’s future traffic? Or an expensive package sold by someone whose own income becomes secure as soon as the buyer signs?
There is no credible basis for declaring that every activity marketed as passive income will fail. Several are established industries with profitable operators. The evidence supports a more precise criticism: automation, growing demand and recurring revenue are routinely presented as though they guarantee attractive returns for an individual purchaser.
That inference does not survive serious financial analysis.
Even the terminology is unstable. In American tax law, “passive activity” has a specific meaning. Under the IRS rules, portfolio income such as interest and dividends is generally excluded from passive activity income. In everyday investment language, those same receipts are among the most obvious examples of income requiring little daily work.
A tax category, a management arrangement and a marketing promise are three different things.
Before discussing returns, we need to establish what belongs in the universe being advertised.
The catalogue is much larger than social media suggests
The principal activities promoted under the passive-income label can be grouped into fourteen broad families. These categories overlap, but the distinctions matter because the capital, work and risks differ substantially.
1. Financial assets and distributions.
Savings accounts, certificates of deposit, Treasury bills, government and corporate bonds, money market funds, dividend-paying shares, distributing ETFs, listed property funds, preferred shares and certain annuities.
These instruments can require relatively little operational work from the investor. Their economic risks remain: inflation, credit deterioration, market-price changes, reinvestment, fees and, where relevant, currency exposure.
A regular distribution also needs interpretation. Depending on the product, it may include income, realised gains or a return of the investor’s own capital.
2. Lending and private investment.
Peer-to-peer lending, property crowdfunding, private credit, mortgage notes, invoice financing, business development companies and minority interests in private businesses.
The borrower’s obligation to pay does not eliminate the possibility of default. An investment can produce regular receipts for years and still generate an unattractive overall result when losses, illiquidity and recovery costs emerge.
3. Residential and commercial property.
Long-term rentals, furnished apartments, student accommodation, rented rooms, holiday homes, serviced apartments, shops, offices, warehouses and rental-arbitrage arrangements.
Management can be delegated. Vacancy, tenant selection, property condition, financing and legal obligations remain part of the investment.
Rental arbitrage introduces a particularly important mismatch: the operator may owe a fixed lease payment while receiving uncertain short-term booking revenue.
4. Space, access and land rights.
Garages, parking spaces, self-storage units, boat and recreational-vehicle storage, agricultural leases, billboard sites, rooftops, telecommunications sites and other access rights.
Some arrangements are operationally simple. Their value can nevertheless depend heavily on location, a single tenant, a concession, planning permission or a contract that eventually expires.
5. Automated washing businesses.
Self-service laundromats, automatic car washes, express wash tunnels, vacuum stations and self-service dog-washing facilities.
In each case, automation changes how the service is delivered. The owner still needs functioning equipment, reliable utilities, cleaning, maintenance, customer support and sufficient local demand.
A self-service dog wash also illustrates how loosely the word “automatic” is used. In the common model, the customer performs the washing. The business supplies the facilities and consumables.
6. Unattended retail and payment infrastructure.
Snack and drink machines, coffee machines, fresh-food vending, ice and water dispensers, micro markets, smart refrigerators, ATMs, amusement and claw machines, photo booths, charging stations and parcel lockers.
These are often businesses built around location agreements and service routes. Restocking, product selection, spoilage, cash handling, machine reliability and the economics of each site can determine the result.
7. Rental of movable assets.
Cars, vans, camper vans, boats, tools, construction equipment, cameras, event furniture, inflatables and specialist clothing.
An asset can earn revenue repeatedly while also wearing out repeatedly. Utilisation must be evaluated alongside depreciation, damage, downtime, insurance and replacement.
8. Intellectual property and licensing.
Books, music, photographs, video footage, fonts, designs, patents, software, datasets and brands.
A successful asset can generate receipts long after its creation. Producing something that attracts durable demand is the difficult part. A catalogue may require years of work before producing meaningful income.
9. Digital products and software.
Online courses, guides, printables, spreadsheets, templates, website themes, plug-ins, mobile applications and subscription software.
Distribution costs can be low. Customer acquisition, updates, support, refunds and competition still affect profitability.
Software with recurring subscriptions can also carry recurring obligations: security, hosting, compatibility and service reliability.
10. Audiences, advertising and referrals.
Blogs, affiliate websites, product-review sites, newsletters, podcasts, video channels, so-called faceless channels, paid communities and lead-generation websites.
These businesses depend on continued attention. Search rankings, platform recommendations, advertisers and audience trust influence whether yesterday’s traffic becomes tomorrow’s income.
11. E-commerce and managed online stores.
Amazon FBA, dropshipping, print-on-demand, retail arbitrage, wholesale resale, Etsy shops and stores operated by third-party agencies.
Outsourcing fulfilment does not resolve sourcing, product-market fit, advertising costs, returns, intellectual-property disputes or platform suspension.
12. Delegated operating businesses.
Franchises, gyms, tanning salons, cleaning companies, pool-service routes, gardening businesses and other activities sold with a manager or operating team.
Delegation can make ownership less demanding. It creates a different responsibility: selecting, paying, supervising and retaining the people who operate the business.
13. Energy, infrastructure and natural resources.
Solar installations, interests in energy projects, leases for renewable infrastructure, mineral royalties, forestry and similar assets.
Income depends on the relevant contracts, production, maintenance, counterparties and market conditions. Different structures expose the investor to very different risks.
14. Crypto-related and miscellaneous arrangements.
Staking, crypto lending, liquidity provision, mining, validator operations and tokenised investment structures.
These activities require careful distinctions between the source of the payment, the asset in which it is paid and the risks to principal.
Referral schemes and multilevel marketing are also frequently presented as routes to residual income. Cashback, promotional bonuses, surveys and selling unwanted possessions sometimes appear on the same lists, despite having very different economic characteristics.
Putting all of these activities under one attractive label does little to help an investor evaluate them.
A dividend portfolio, a dog-washing station and an online course do not become comparable investments because their promoters use the same adjective.
Who is looking for this income?
There is no comprehensive statistical census of “passive-income entrepreneurs”. Any analysis claiming to describe them precisely should explain how the population was identified.
Surveys of side hustles, gig work and investment ownership illuminate different parts of the story. They cannot be treated as interchangeable.
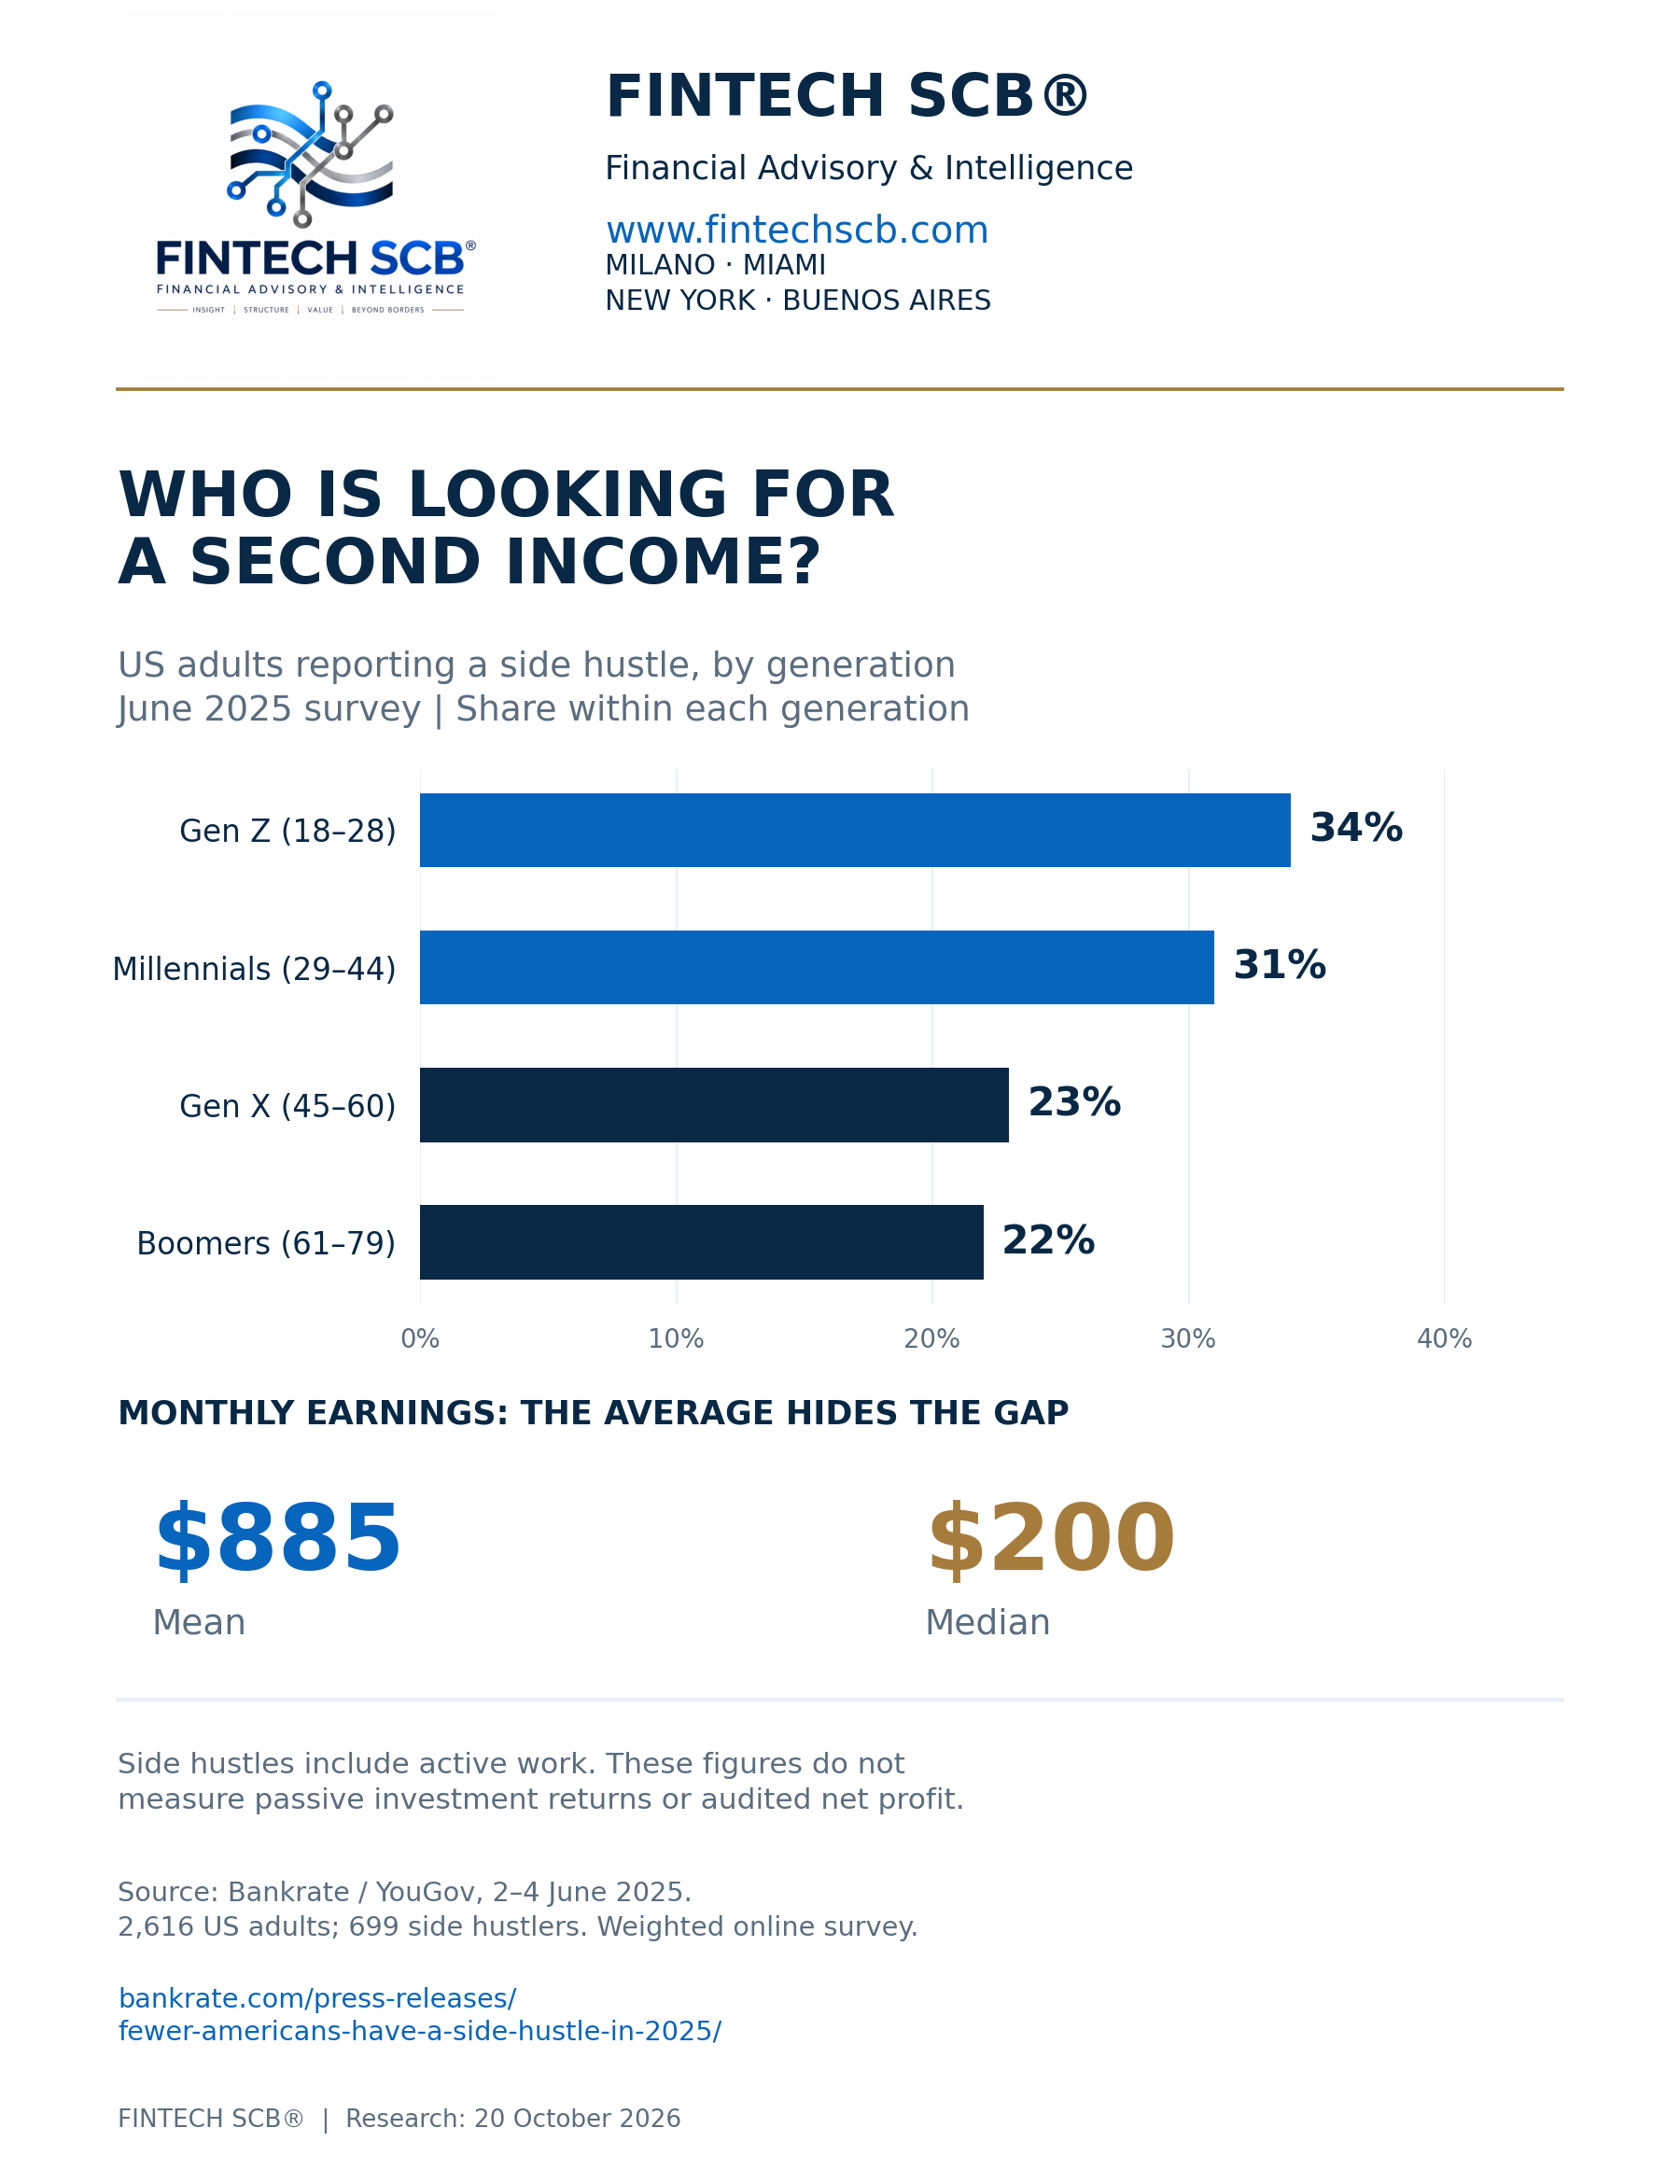
Bankrate’s 2025 survey, conducted by YouGov among 2,616 American adults, found that 27% had a side hustle. The proportion was 34% among Generation Z adults, 31% among millennials, 23% among Generation X and 22% among baby boomers.
Among respondents with side hustles, reported average monthly earnings were $885. The median was $200.
That gap matters. A relatively small number of higher earners can lift the average well above the experience of the person in the middle.
The same survey found that 35% used at least some side-hustle money for regular living expenses. For a significant group, additional work was helping to pay ordinary bills.
These are reported earnings from side hustles, which include active work. They are not audited passive-investment returns.
The Federal Reserve’s 2024 household survey provides another perspective. About 20% of adults reported gig activities during the preceding month, including selling items and performing short-term tasks. Around 2% reported short-term rental activity.
Among people undertaking gig activities, 49% wished the pay were more consistent, while 31% said they would struggle to make ends meet without the income.
Flexibility and financial fragility can therefore coexist. A second income stream may provide useful support while remaining uncertain.
Access to genuinely low-maintenance financial assets is also uneven. The Federal Reserve’s 2022 Survey of Consumer Finances found that direct or indirect stock ownership reached approximately 34% among families in the bottom half of the usual-income distribution, compared with 95% among the top tenth.
That measure includes retirement accounts. It does not identify people pursuing a passive-income strategy. It does show how strongly participation in financial ownership differs across income groups.
The distinction is economically important.
People with accumulated capital can purchase diversified financial claims. People with limited capital are more likely to encounter proposals that combine a small initial investment with substantial personal work, borrowing or concentrated business risk.
The language of financial freedom often conceals that difference in starting conditions.
Laundromats: the purchase price can absorb the opportunity
Laundromats provide a clear example of why operating demand and investment attractiveness must be evaluated separately.
People need clean clothes. That does not establish that a particular shop, bought at a particular price, will produce an adequate return.
BizBuySell’s full-year 2025 transaction data recorded 169 reported laundromat sales. The median sale price was $287,000.
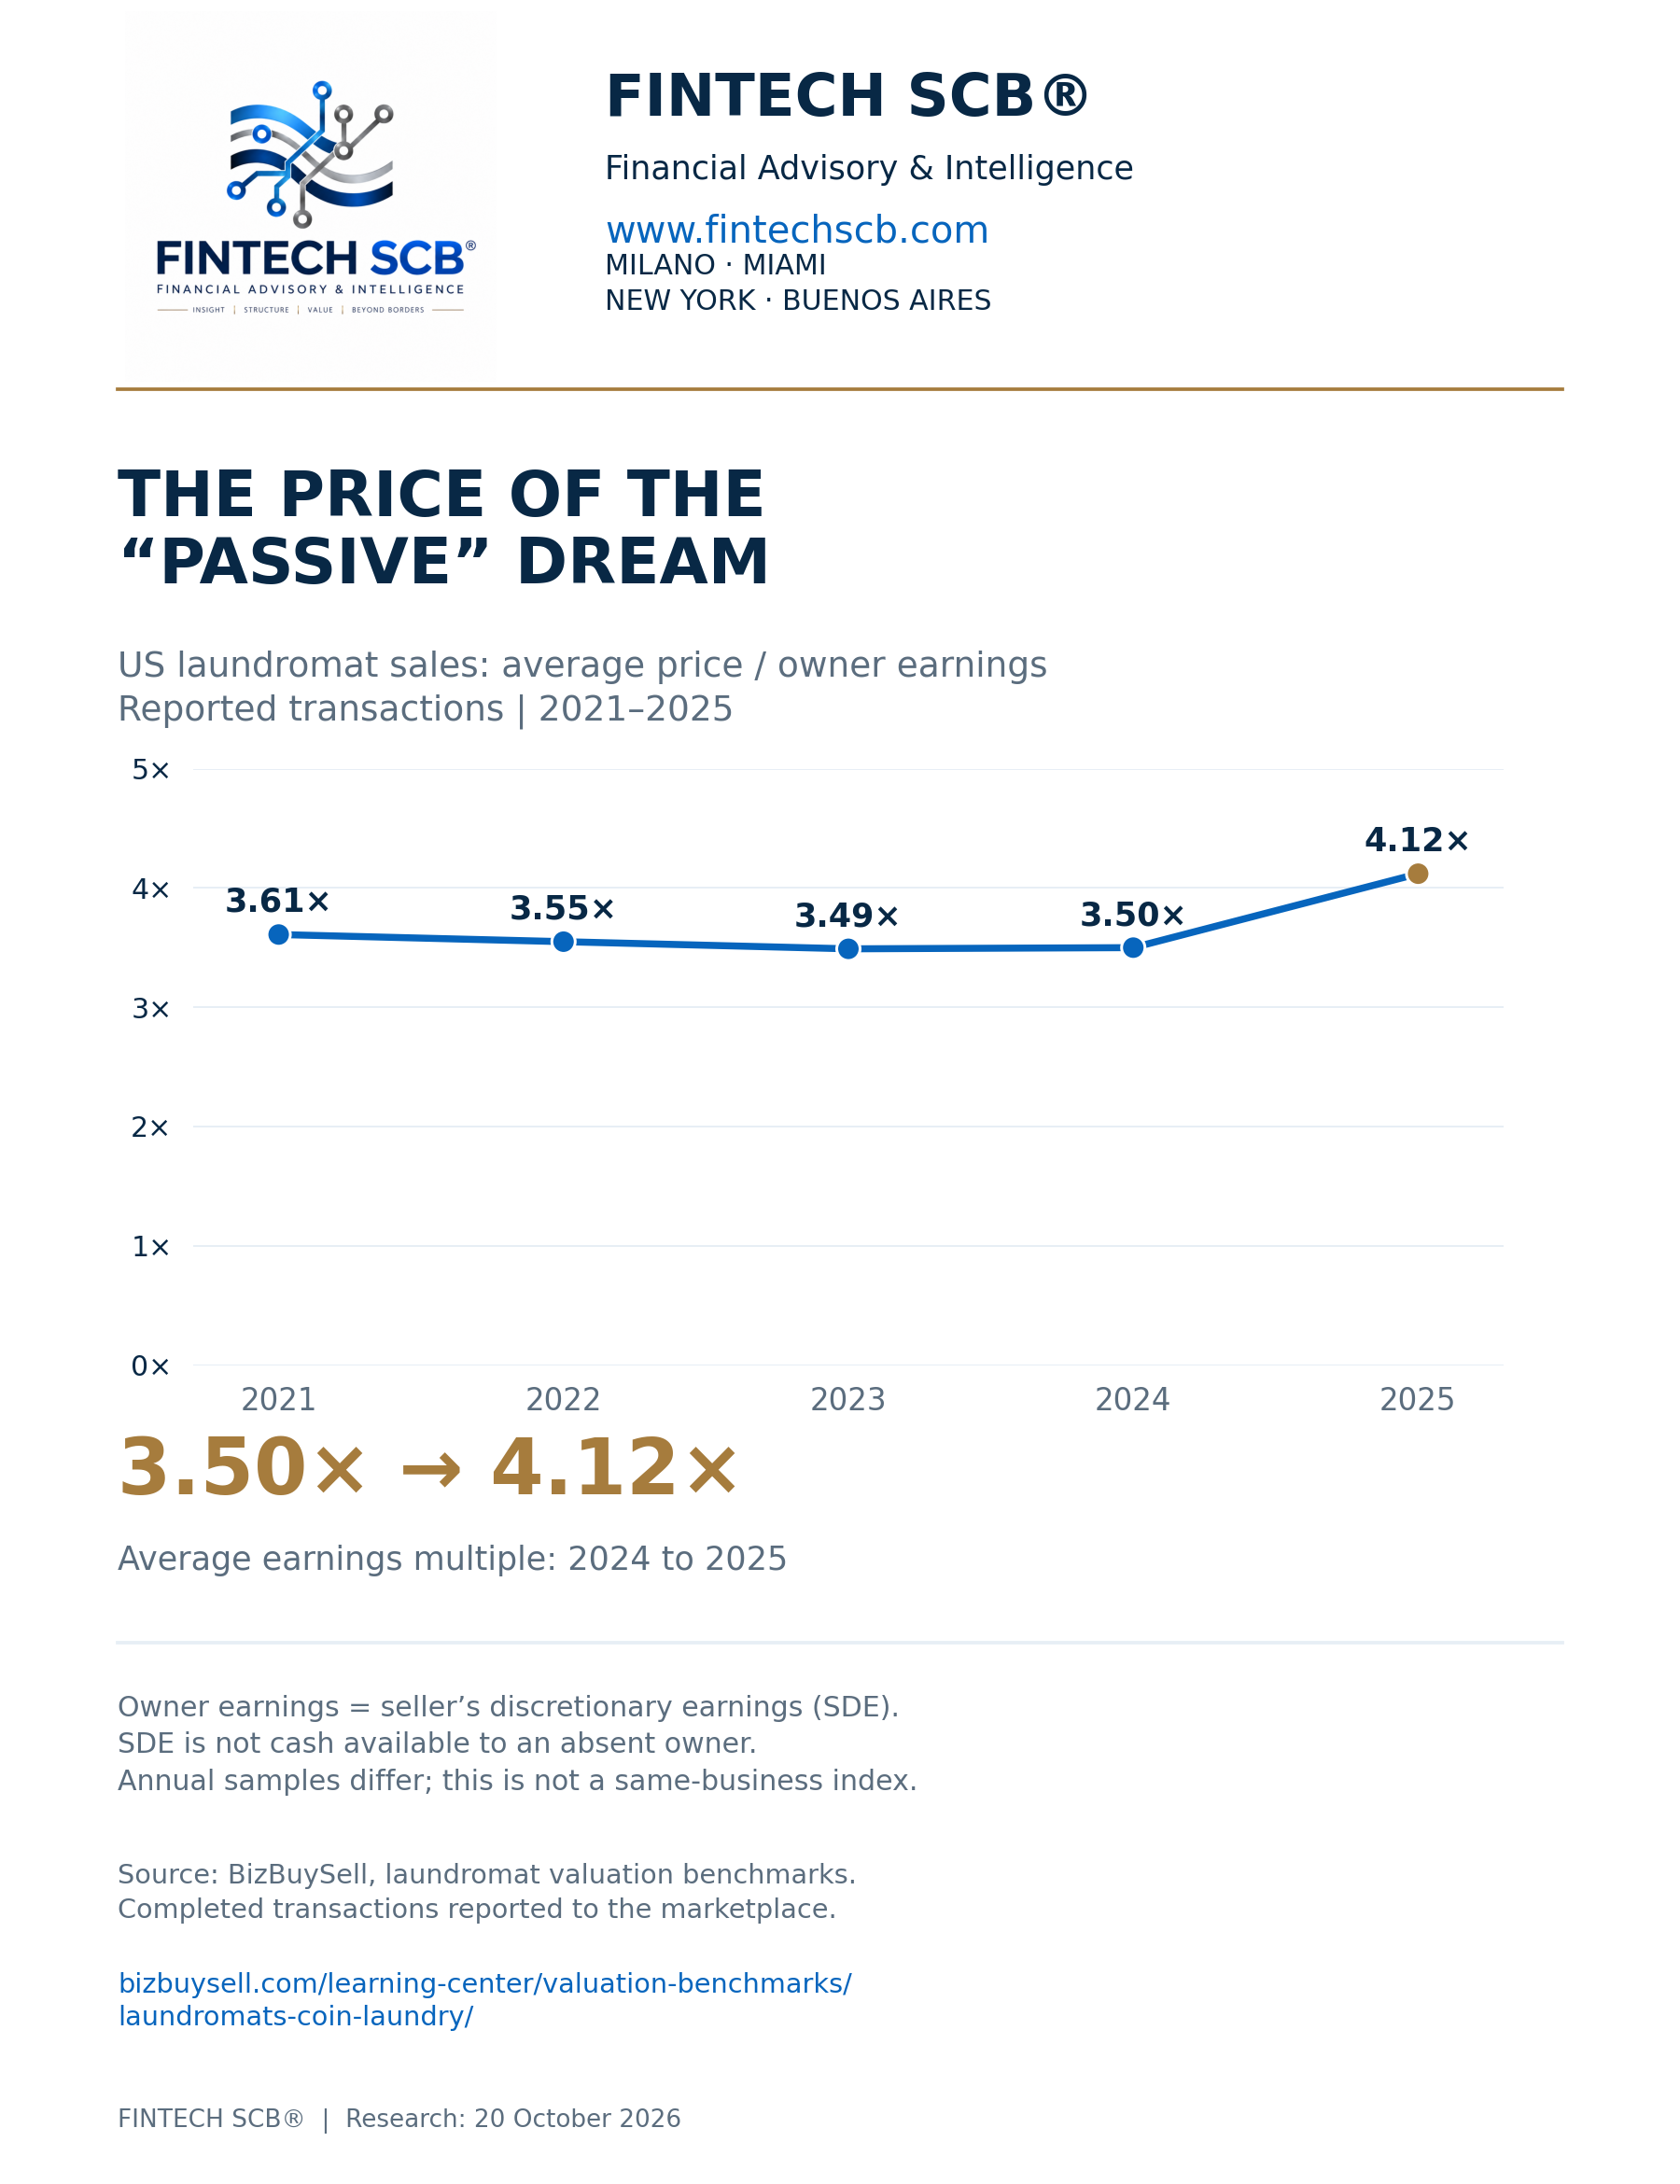
Its laundromat valuation series shows that the average sale-price multiple of seller’s discretionary earnings rose from 3.50 times in 2024 to 4.12 times in 2025.
Those are different annual transaction samples. They do not prove that the same laundromat appreciated by a corresponding percentage. They do show that completed transactions reported to the platform were being priced at substantial multiples of an owner-oriented earnings measure.
Seller’s discretionary earnings, or SDE, requires particular attention.
It typically adds back an owner’s compensation and certain other expenses. That can help describe the economic benefit available to an owner-operator. It does not automatically describe the cash available to an absentee investor.
If the departing owner cleaned the premises, managed staff, handled complaints and supervised repairs, somebody must continue doing that work.
The appropriate adjustment depends on the business. If a manager is already employed and their full cost is already included, deducting the same cost again would be wrong. If the owner’s work is being added back without providing for a replacement, treating the resulting figure as passive income would also be wrong.
The price paid for the business is another constraint.
An attractive operating model can become an unattractive investment when the acquisition price assumes a level of growth, efficiency or owner availability that the buyer cannot deliver.
Social-media popularity can increase demand for buying a business without increasing demand for the service it sells.
That is an important distinction. More aspiring laundromat owners do not necessarily mean more laundry customers.
Self-service dog washes: a large pet market proves very little about one machine
The pet economy attracts the same reasoning.
The American Pet Products Association reported $152 billion in US pet-industry spending in 2024. That establishes the scale of the broad market.
It does not establish the profitability of a standalone self-service dog-washing operation.
A facility inside an existing pet retailer or rural-supply store may share rent, parking, staff, cleaning arrangements and customer acquisition with the wider business.
A standalone operator has to support more of those costs directly.
Tractor Supply, for example, has advertised a $9.99 self-service pet wash at a local store. That is an identifiable offer, rather than an industry-wide price or evidence of a standalone investor’s margin.
The analytical point is the difference in business structure. A service can work as an additional amenity inside a larger operation while being much harder to sustain on its own.
I have not identified a robust, representative dataset establishing national failure rates or investor returns specifically for standalone self-service dog washes.
That gap prevents a defensible claim that the sector universally succeeds or universally fails. It also makes confident promotional return claims harder to evaluate.
A photograph of a working installation tells us that the equipment exists. It tells us little about utilisation, operating costs or the return on the capital committed.
Car washes: evidence of professionalisation, with real counterexamples to the failure narrative
Car washing provides an important correction to any indiscriminate argument that automated businesses have no future.
Mister Car Wash reported approximately $1.052 billion in revenue for 2025, up 6%, and $103.1 million in net income. Comparable-store sales increased 2.9%.
The company finished the year with 548 locations. Membership subscriptions accounted for 79% of wash sales in the fourth quarter.
Those results demonstrate that a scaled operator can build a substantial, profitable business.
They do not demonstrate that an individual purchaser can reproduce the same economics with one site.
A large chain can distribute management, technology and procurement costs across many locations. It can also accumulate operating data and develop a membership base.
A small investor may bear comparable categories of risk with far less diversification.
The growing importance of subscriptions adds another consideration. Recurring revenue is valuable when customers stay, use the service at economically manageable levels and continue paying enough to support operations.
A subscription payment is evidence of revenue recurrence. It is not sufficient evidence of durable profitability.
The likely competitive challenge for weaker operators is professionalisation: customers increasingly compare price, convenience, equipment quality and service consistency across alternatives.
Vending: a service-route business behind an unattended transaction
A vending machine is unattended at the moment of purchase. Its owner’s business may be labour-intensive over the full operating cycle.
Stock must be bought, transported and replenished. Products expire. Machines malfunction. Locations may demand commissions. A workplace can reduce attendance or change suppliers.
Route density matters because servicing nearby machines can be more efficient than travelling long distances between isolated sites.
NAMA’s 2024–25 industry study estimated that the broader US convenience-services industry would reach $31.1 billion in 2025. The figure included activities such as vending, micro markets and office coffee services.
The 2025 number was a preliminary industry estimate, rather than an audited total of realised profits.
It is useful evidence of sector scale and activity. It does not identify what a new operator retains after purchasing stock, servicing machines and compensating their own labour.
The evolution towards micro markets and smart retail systems may create opportunities while also raising expectations around product range, payment technology and operating reliability.
An expanding industry can reward capable operators and still disappoint poorly located or poorly managed entrants.
ATMs and cash-dependent models: structural change requires careful interpretation
Cash remains important, but its role is changing.
The European Central Bank’s SPACE study found that cash accounted for 52% of point-of-sale transactions by number in the euro area in 2024, down from 59% in 2022.
For vending-machine transactions, the reported cash share fell from 74% to 55%.
A falling share does not, by itself, establish a fall in absolute transaction volume. It certainly does not establish the profitability of a particular ATM.
The figures nevertheless challenge business plans that assume payment behaviour will remain unchanged.
An ATM’s economics depend on the location, transaction volume, fee arrangements, replenishment, security and the availability of alternatives.
A cash-intensive tourist location and an increasingly cashless office district require different assumptions.
For unattended retail, payment flexibility may help preserve demand. For an owner relying on cash-withdrawal fees, the same shift can create a more direct challenge.
Technology can improve the customer experience while weakening an older revenue model.
Self-storage: recurring demand still faces local competition
Self-storage is frequently marketed as a particularly clean form of property income: relatively simple units, recurring payments and fewer apparent complications than residential tenants.
Yet supply, pricing and occupancy still matter.
Public Storage reported flat same-store revenue for 2025 and a 0.5% decline in same-store net operating income. Average occupancy was approximately 92%, compared with 92.4% in 2024.
These figures describe an established operator. They do not establish distress across the whole industry.
They illustrate something more useful: even a large, professional business with substantial occupancy can experience pressure on operating returns.
A market can appear attractive to many investors simultaneously. When enough capacity is added in the same area, the resulting competition can reduce pricing power.
The demand for storage space does not remove the need to examine the supply of storage space.
Property rentals: demand growth does not resolve the owner’s calculation
Short-term accommodation offers another example of why broad market growth is insufficient.
Eurostat recorded 951.6 million guest nights in EU short-stay accommodation booked through Airbnb, Booking and Expedia in 2025, an increase of 11.4% from 2024.
These are guest nights, rather than owner profits or a measure of the return on a particular apartment.
The result depends on the purchase price, financing, occupancy, nightly rates, commissions, management, cleaning, maintenance and the rules applying to the property.
A growing market can attract enough new supply to leave individual owners competing more aggressively.
For a foreign investor, exchange-rate movements add another layer. Income earned in one currency and measured against obligations in another can fluctuate even when the underlying property performs steadily.
Property analysis also requires a precise treatment of mortgage payments.
Interest is a financing cost. Principal repayment reduces cash available to the owner but also reduces the outstanding debt and builds equity.
Ignoring principal repayments overstates spendable cash. Treating every principal repayment as an economic loss understates the change in the owner’s balance sheet.
A serious assessment needs both the cash-flow statement and the balance sheet.
Digital passive income: the distribution channel can change faster than the product
Digital businesses are often presented as the purest form of scalability.
Create an asset once. Sell it repeatedly. Avoid physical inventory.
That can be a genuine advantage. It leaves the question of how customers discover the product.
Pew Research Center examined browsing activity among 900 US adults in March 2025. Users clicked a traditional search-result link on 8% of visits containing an AI summary, compared with 15% of visits without one.
This was an observational comparison. Different types of queries can produce different results, so the figures should not be treated as a controlled estimate of the effect on every publisher.
They nevertheless identify a material risk for websites built around attracting search traffic and monetising the resulting visits.
Generic explanatory content can face pressure when the search interface itself supplies an adequate answer.
A website’s historical traffic is therefore a commercial asset whose durability must be examined. It is not a contractual entitlement.
The same applies to video recommendations, social-media distribution and marketplace visibility.
Owning the content and controlling its route to the customer are different economic positions.
Marketplaces: scale can coexist with difficult seller economics
Etsy’s core marketplace generated approximately $10.5 billion in gross merchandise sales in 2025, down 4%, and reported about 5.6 million active sellers.
Gross merchandise sales measure transactions on the marketplace. They do not measure seller earnings.
A seller must still account for materials, production, advertising, platform charges, shipping, returns and their own time.
Dividing aggregate marketplace sales by the number of active sellers would not establish a representative income. Seller activity varies substantially, and sales are unevenly distributed.
The more recent evidence also matters. Etsy reported that core marketplace gross merchandise sales increased 7.5% year on year in the second quarter of 2026.
That recovery makes a simplistic permanent-decline story difficult to defend.
The sounder conclusion concerns the distinction between the platform’s commercial activity and the economics of each participant.
An individual seller needs a viable product, visibility and an adequate margin. Platform growth cannot supply all three automatically.
Books, royalties and creators: a long tail is not a typical outcome
Royalties can continue after the original work is completed. Their existence says little about how widely substantial earnings are distributed.
The Authors Guild’s 2023 survey, covering 2022 income, reported median book income of $2,000 among participating authors overall.
Among full-time authors, median book income was $10,000. Full-time self-published authors reported a median of $12,800.
The survey covered published authors. It should not be presented as a forecast for someone opening a publishing account today.
CreatorIQ’s report on 2025 creator compensation provides another measure of concentration within its observed payment data: the top 10% of creators received 62% of payments.
That dataset does not describe every creator worldwide. It does show why exceptional success stories are a weak basis for estimating an ordinary entrant’s prospects.
A successful creator may have spent years building a catalogue, audience or professional reputation.
The visible payment can be the result of accumulated work that the promotional narrative leaves outside the frame.
Managed online stores: documented enforcement cases expose the danger of the promise
Some of the strongest evidence against easy-income marketing comes from consumer-protection enforcement.
In June 2025, the US Federal Trade Commission announced a proposed settlement concerning Ascend Ecom and its owners. The FTC alleged that the operation had cost consumers at least $25 million through deceptive online-business opportunity claims.
The announced monetary judgment was partly suspended based on inability to pay. A headline judgment amount should therefore not be confused with money fully returned to affected customers.
In the separate Automators case, FTC action led to 2024 settlements that included bans on certain business-opportunity activities for two owners.
These are specific enforcement cases. They do not justify calling every managed-store provider fraudulent.
They do demonstrate why claims of automated profits require evidence beyond testimonials, sales presentations and screenshots of revenue.
The FTC’s 2024 review of income disclosures from 70 multilevel marketing companies identified another recurring problem: many participants received no payments, and the vast majority received $1,000 or less annually. Expenses were frequently inadequately reflected.
That review concerns the companies and disclosures examined. It cannot be turned into a universal failure rate for all passive-income investments.
The common analytical concern is the way an income claim can omit the costs, unsuccessful participants or continuing work required to generate it.
The financial statement must include the owner
Much of the confusion disappears when the owner’s contribution becomes visible.
If an owner handles administration, repairs, marketing, customer complaints and staff cover, those hours have economic value.
A business may provide an acceptable combined return for the owner’s labour and invested capital. Presenting the combined amount as a return on capital alone gives a misleading impression.
Replacement spending also matters.
Equipment does not retain its productive capacity indefinitely. Accounting depreciation and the actual timing of replacement expenditure differ, but the underlying requirement to renew assets remains.
Likewise, working capital can absorb cash even when reported profit rises. Inventory, deposits, receivables and seasonal spending may require funding before the business receives payment.
A useful analysis therefore asks how operating cash is produced, what must be reinvested, how debt is serviced and what remains available after necessary management has been paid.
Passivity itself has a price.
A business genuinely able to operate with reliable management and limited owner involvement may command a higher acquisition valuation. Alternatively, the owner may have to pay ongoing management fees to obtain that arrangement.
In both cases, part of the apparent advantage can be absorbed by the cost of acquiring or maintaining it.
Which models face the weakest future?
The available evidence does not support declaring that laundromats, pet washes, rental properties or digital products as entire categories have no future.
It does support concern about particular business models.
Businesses purchased at demanding valuations have less room for disappointing performance.
Single-site operations face concentrated exposure to location, local competition and unexpected disruption.
Undifferentiated online products can face intense competition and rising difficulty in attracting attention.
Search-dependent content businesses face changes in how answers are delivered to users.
Cash-dependent models must respond to changing payment behaviour.
Equipment-heavy operations face maintenance and replacement obligations that do not disappear when sales soften.
Businesses relying on unpaid owner labour can become less attractive when that labour must be replaced.
Highly leveraged owners have less flexibility to absorb weak trading periods.
These vulnerabilities can combine.
A viable industry does not protect every entrant. A successful location does not validate every acquisition price. A useful machine does not create sufficient customer demand simply by being installed.
The stronger operators may continue to grow while weaker entrants struggle.
That is why professionalisation is a more defensible forecast than universal collapse.
Follow the incentives before following the income
The person selling the opportunity may have a different financial exposure from the person buying it.
An equipment supplier receives payment for the equipment. A broker receives a transaction fee. A platform collects charges on activity. A course seller receives tuition. A lender expects interest and principal.
The owner receives the residual after the relevant costs and obligations.
Those arrangements can be legitimate and useful. They should still be understood.
A profitable market for selling business opportunities can coexist with disappointing results for some of the buyers.
The evidence needed to assess the opportunity therefore concerns the operating business: documented revenue, costs, owner involvement, asset condition, financing and customer demand.
A promoter’s audience size does not answer those questions.
Neither does the promoter’s own success if that success comes principally from selling training, equipment or access to the model.
The FINTECH SCB perspective
Financial independence is a serious objective. It deserves analysis that takes both capital and work seriously.
Some income streams require little ongoing operational involvement because the investor owns financial claims. Some businesses become less demanding after systems and management have been developed. Some royalties continue after years of creative work.
Each case has an economic history and a cost.
The central weakness of much passive-income marketing is the compression of that history into a purchase decision.
It suggests that acquiring an asset or subscribing to a system will deliver the result without requiring the buyer to evaluate everything that supports it.
The more useful distinction is between activities with understandable economics and activities whose attractiveness depends on leaving essential costs or risks unexplained.
We should also be precise about failure.
A closed business, an insolvent owner, a disappointing return, a heavily worked owner and an overpriced acquisition are different outcomes. Available statistics do not measure them consistently across the entire passive-income universe.
Claiming a single failure rate would create the same problem this analysis seeks to expose: confidence unsupported by comparable evidence.
What the data do show is that supplementary income is often modest, participation is shaped by financial circumstances, ownership is unevenly distributed and several apparently automated businesses depend on substantial operating capabilities.
They also show viable companies and growing markets.
That combination is the reason to investigate individual economics carefully.
People looking for security should not be mocked for wanting another source of income. Their motivation is often entirely rational.
They deserve to know whether they are acquiring an investment, undertaking a business or committing themselves to work that has been removed from the sales description.
Before celebrating the income, identify the work.
Before admiring the revenue, identify the costs.
Before buying the opportunity, identify who has already been paid.
Roberto Balbino
Founder & CEO, Fintech SCB
FINTECH SCB®
Financial Advisory & Intelligence
www.fintechscb.com
MILANO · MIAMI · NEW YORK · BUENOS AIRES
Independent editorial analysis, available free of charge.
SOURCES AND METHODOLOGICAL NOTES
Research reference date: 20 October 2026.
The figures below refer to their stated reporting periods. Surveys, marketplace transaction samples, company accounts and regulatory cases describe different populations. They must not be combined into a single estimate of the success or failure of “passive income”.
No hypothetical investment-return simulations have been used.
1. The Wall Street Journal — John Keilman, “The Internet Told Them Owning a Laundromat Was Easy Money. It Was Anything But”, 19 October 2026.
https://www.wsj.com/business/the-internet-told-them-owning-a-laundromat-was-easy-money-it-was-anything-but-2ca220c7
2. Internal Revenue Service — Publication 925, Passive Activity and At-Risk Rules. Used to distinguish US tax terminology from the everyday investment expression.
https://www.irs.gov/publications/p925
3. Bankrate / YouGov — “Fewer Americans Have a Side Hustle in 2025”, 9 July 2025. Survey of 2,616 US adults, including 699 side hustlers. Fieldwork: 2–4 June 2025. Reported side-hustle earnings are not audited passive-investment profits.
https://www.bankrate.com/press-releases/fewer-americans-have-a-side-hustle-in-2025/
4. Federal Reserve — Economic Well-Being of U.S. Households in 2024, Employment and Gig Work, published in 2025.
https://www.federalreserve.gov/publications/2025-economic-well-being-of-us-households-in-2024-employment-and-gig-work.htm
5. Federal Reserve — Changes in U.S. Family Finances from 2019 to 2022: Evidence from the Survey of Consumer Finances. Stock ownership includes direct and indirect holdings.
https://www.federalreserve.gov/publications/october-2023-changes-in-us-family-finances-from-2019-to-2022.htm
6. BizBuySell — Insight Report data tables, full-year 2025. Figures concern completed transactions reported to the platform, rather than a census of all businesses.
https://www.bizbuysell.com/insight-report-data-tables/
7. BizBuySell — Laundromat and coin-laundry valuation benchmarks. Annual transaction samples differ; the multiples are not a same-business price index.
https://www.bizbuysell.com/learning-center/valuation-benchmarks/laundromats-coin-laundry/
8. BizBuySell — Seller’s Discretionary Earnings: definition and valuation use.
https://www.bizbuysell.com/learning-center/article/sellers-discretionary-earnings/
9. American Pet Products Association — 2025 State of the Industry Report release, reporting 2024 US pet-industry spending. The total is not a measure of the self-service dog-wash market.
https://americanpetproducts.org/news/the-american-pet-products-association-appa-releases-2025-state-of-the-industry-report-archive
10. Tractor Supply — Rome, Georgia store page, local self-service pet-wash offer. The advertised price is a specific offer, not a national average or a measure of profitability.
https://www.tractorsupply.com/tsc/store_rome-ga-30165_3009
11. Mister Car Wash — Fourth-quarter and full-year 2025 results, filed with the US Securities and Exchange Commission. Annual and quarterly measures are identified separately in the text.
https://www.sec.gov/Archives/edgar/data/1853513/000119312526056047/d113732dex991.htm
12. NAMA / Technomic — 2024–25 convenience-services industry census. The 2025 market-size figure was a preliminary estimate.
https://namanow.org/new-census-reveals-shifts-in-convenience-services-industry/
13. European Central Bank — Study on the Payment Attitudes of Consumers in the Euro Area, SPACE 2024. Transaction shares do not establish individual ATM or vending-operator profitability.
https://www.ecb.europa.eu/stats/ecb_surveys/space/html/ecb.space2024~19d46f0f17.en.html
14. Public Storage — Fourth-quarter and full-year 2025 results. The text uses annual same-store operating figures.
https://investors.publicstorage.com/news-events/press-releases/news-details/2026/Public-Storage-Reports-Fourth-Quarter-and-Full-Year-2025-Results/default.aspx
15. Eurostat — EU short-stay accommodation booked through online platforms, 2025 results, published 1 April 2026. Figures measure guest nights.
https://ec.europa.eu/eurostat/en/web/products-eurostat-news/w/ddn-20260401-1
16. Pew Research Center — “Google users are less likely to click on links when an AI summary appears in the results”, 22 July 2025. Observational browsing data from March 2025.
https://www.pewresearch.org/short-reads/2025/07/22/google-users-are-less-likely-to-click-on-links-when-an-ai-summary-appears-in-the-results/
17. Etsy — Annual Report 2025, Form 10-K. Marketplace gross merchandise sales are not seller profits.
https://www.sec.gov/Archives/edgar/data/1370637/000137063726000019/etsy-20251231.htm
18. Etsy — Second-quarter 2026 shareholder letter. Included to reflect the subsequent recovery in core marketplace gross merchandise sales.
https://investors.etsy.com/sec-filings/all-sec-filings/content/0001370637-26-000079/q226shareholderletter.htm
19. Authors Guild — Key Takeaways from the 2023 Author Income Survey. Income reference year: 2022. Results concern participating published authors.
https://authorsguild.org/news/key-takeaways-from-2023-author-income-survey/
20. CreatorIQ — State of Creator Compensation, released January 2026, reporting 2025 payment data. The observed distribution is not a census of all creators.
https://www.creatoriq.com/press/releases/state-of-creator-compensation-
21. Federal Trade Commission — Ascend Ecom settlement announcement, 23 June 2025. Allegations, proposed settlement terms and recoverable amounts must be distinguished.
https://www.ftc.gov/news-events/news/press-releases/2025/06/ftc-case-leads-order-banning-ascend-ecom-its-owners-business-opportunity-marketing
22. Federal Trade Commission — Automators case record and enforcement materials.
https://www.ftc.gov/legal-library/browse/cases-proceedings/automators
23. Federal Trade Commission — Staff report on multilevel marketing income disclosures, September 2024. Review of 70 companies’ public disclosures.
https://www.ftc.gov/news-events/news/press-releases/2024/09/ftc-staff-issue-report-multi-level-marketing-income-disclosures
SUBSTACK TAGS
Passive Income, Small Business, Entrepreneurship, Financial Literacy, Business Valuation, Cash Flow, Real Estate, Digital Economy, Consumer Protection, Wealth Management, Fintech SCB
#PassiveIncome #SmallBusiness #Entrepreneurship #FinancialLiteracy #BusinessValuation #CashFlow #RealEstate #Laundromats #CarWash #DogWash #Vending #SelfStorage #Ecommerce #CreatorEconomy #InvestmentRisk #ConsumerProtection #WealthManagement #FintechSCB
Originally published on Substack.
Segui Roberto Balbino su Substack