
SEX MAKES BILLIONS. WHO PAYS FOR THE RISK?
The financial machinery of desire, the unequal cost of sexually transmitted infections, and the uncomfortable evidence that should change how we invest in prevention
By Roberto Balbino | FINTECH SCB
Research cut-off: 24 October 2026
The business of desire can measure a payment to the cent. Public health often struggles to count the consequences of a sexual encounter at all. Between those two systems lies a revealing economic problem: income is booked by identifiable businesses, while risk moves through households, healthcare budgets and sexual networks that no single balance sheet captures.
Two articles in The Economist provide the starting point. “The new economics of sex work”, published on 19 March 2026, examines a market that economics has too often left to other disciplines. “Sexually transmitted infections are surging in Europe”, published in August, examines a different failure: the resurgence of infections and the weaknesses of prevention and surveillance. Read together, they invite a financial investigation into who captures value, who bears uncertainty and which institutions have an incentive to reduce it. [1, 2]
The connection requires care. Digital adult content, dating services, consensual paid sex and the wider sexual lives of the population are distinct markets and activities. Watching content does not transmit an infection. The financial accounts of a platform cannot establish that it caused an epidemic, and national infection totals cannot be attributed wholesale to sex work. What connects these subjects is the allocation of income, bargaining power, information and health risk. That is a substantial economic story without inventing a causal shortcut.
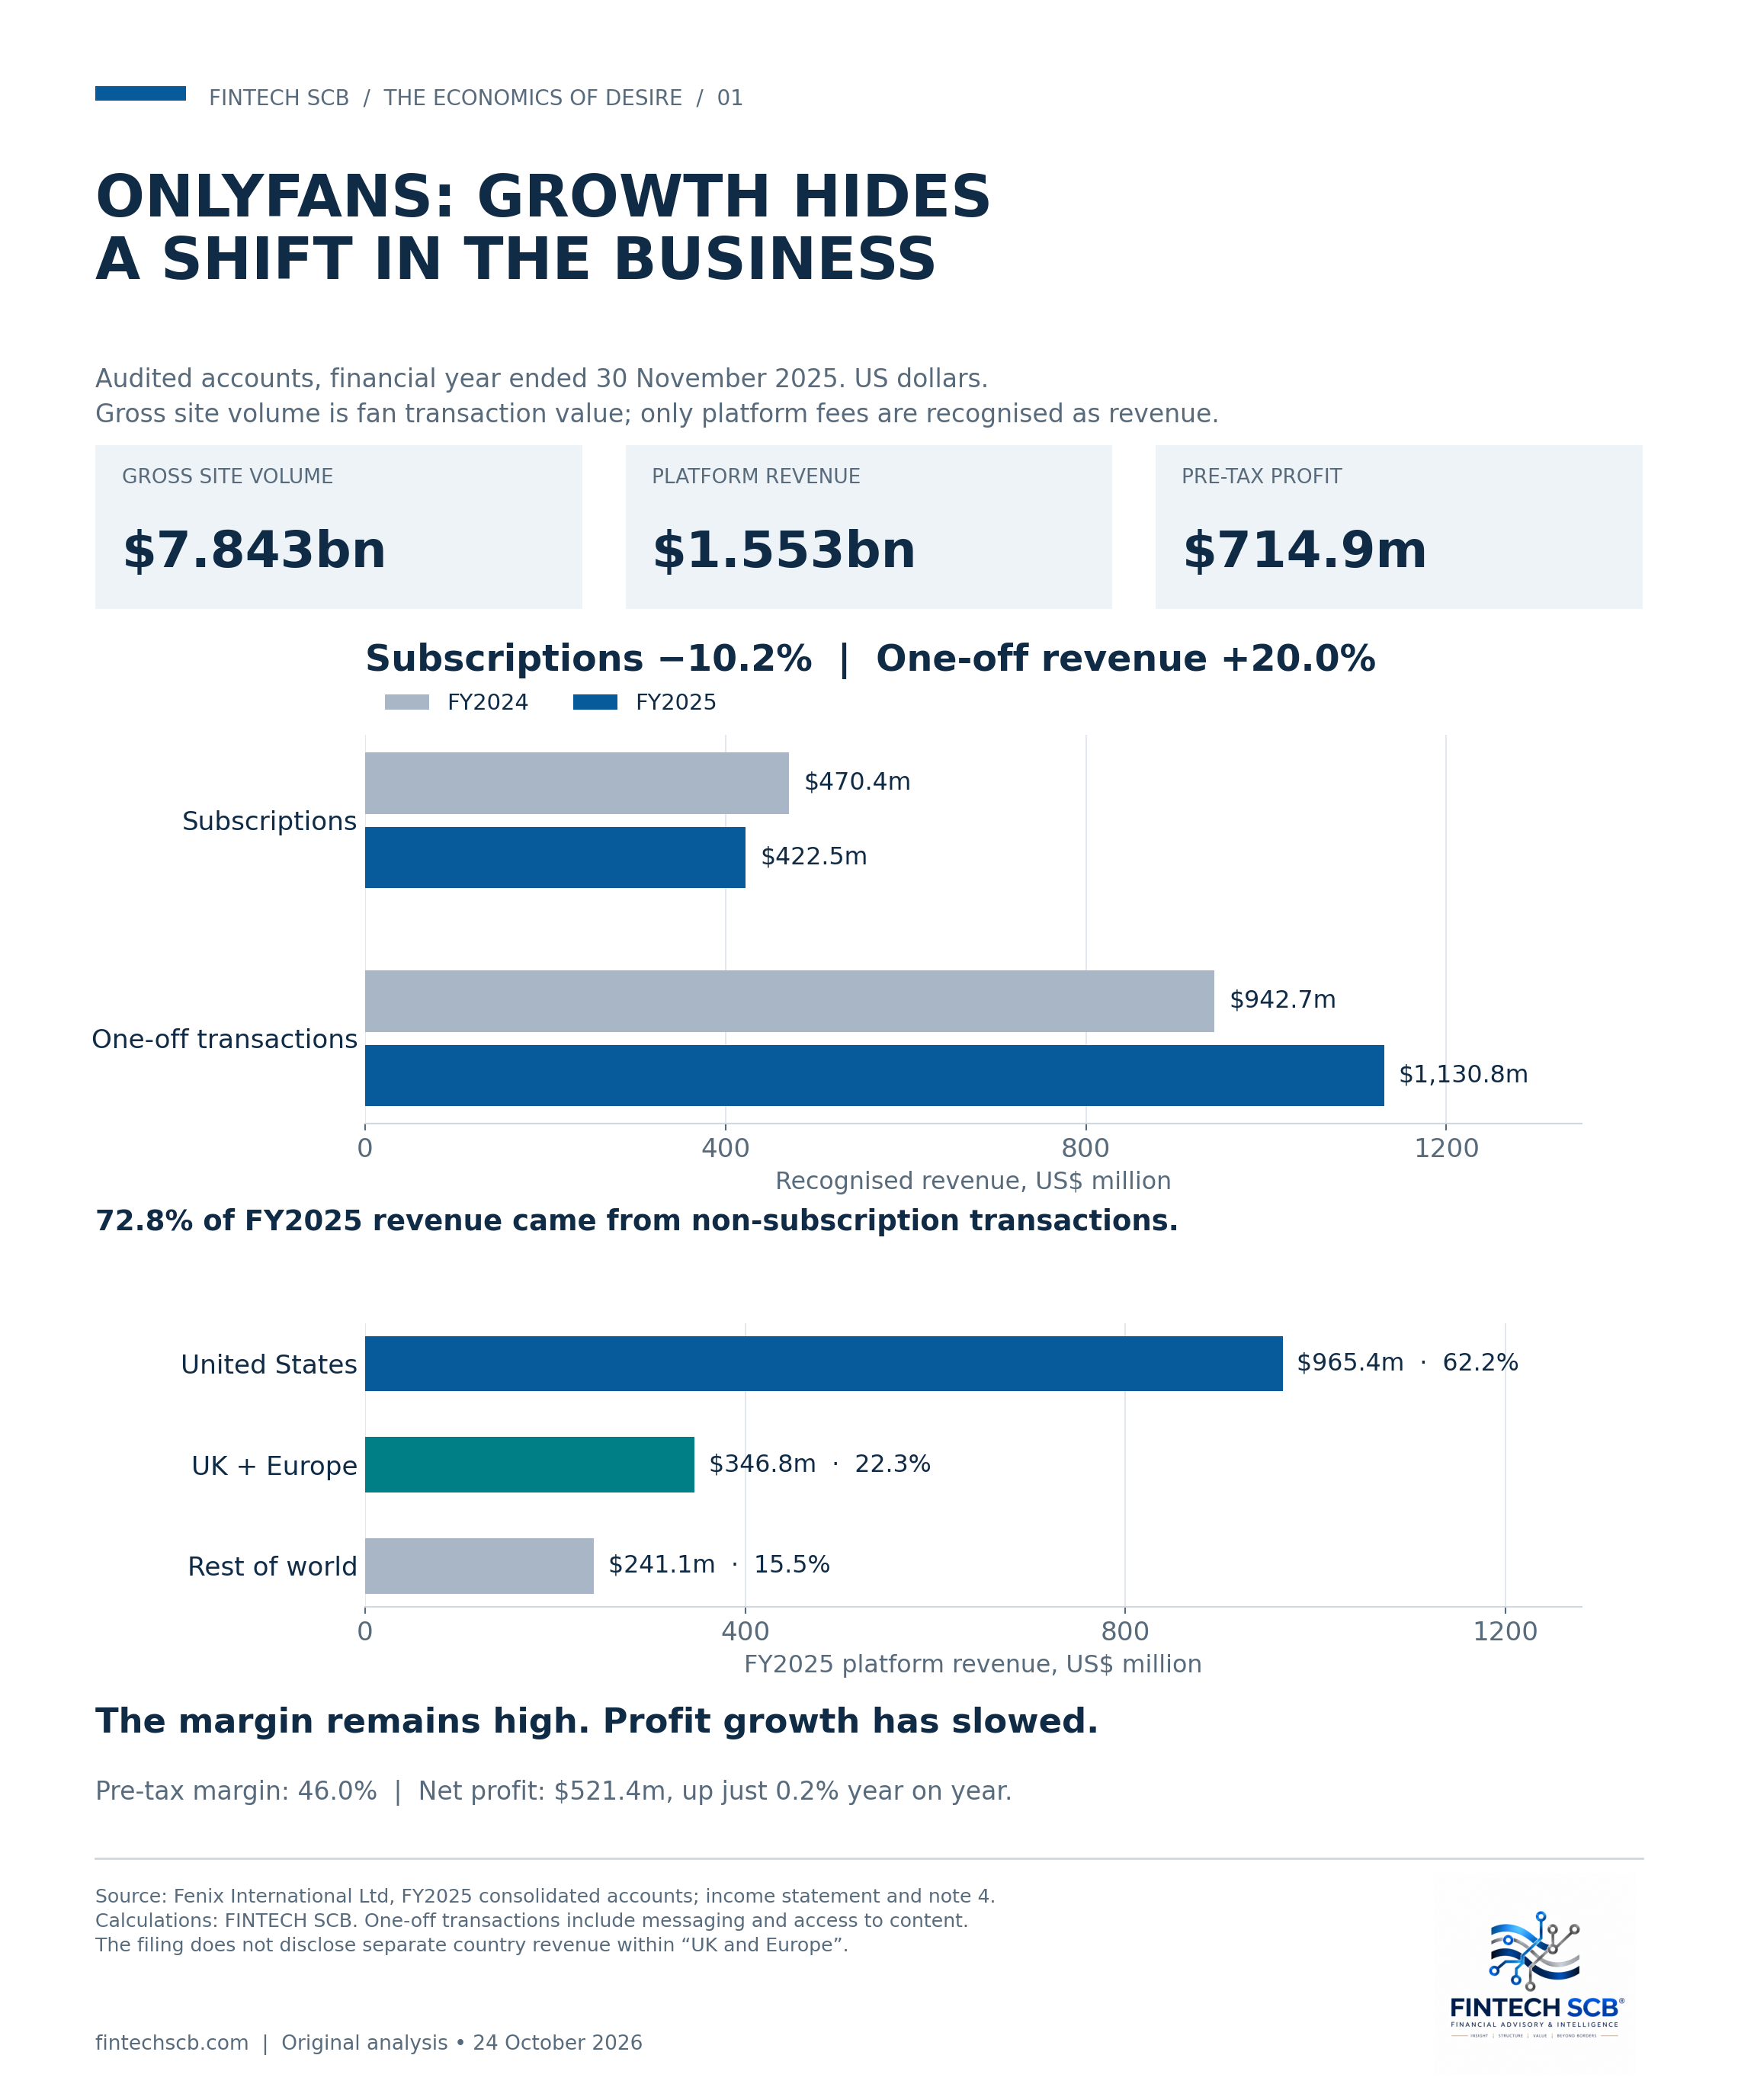
Start with the money that can actually be audited. Fenix International, the company behind OnlyFans, reported $7.843 billion in gross site volume for its financial year ending in November 2025. Its own revenue was $1.553 billion. Profit before tax was $714.9 million. These are three different quantities: transactions through the platform, the revenue recognised by the intermediary and the profit remaining after its expenses. Calling the first figure “OnlyFans revenue” overstates the company's accounting revenue approximately fivefold. [3]
The distinction changes the interpretation of profitability. Pre-tax profit was 46.0% of platform revenue, but 9.1% of gross site volume. The difference between those percentages is the economic territory occupied by creators and the platform's accounting boundary. A high margin on the intermediary's recognised revenue says something about the profitability of intermediation; it does not establish that the entire production chain enjoys that margin.
The more revealing development is below the headline. Subscription revenue fell from $470.4 million in 2024 to $422.5 million in 2025, a decline of 10.2%. Non-subscription revenue rose from $942.7 million to $1.131 billion, an increase of 20.0%. That category, which includes one-off transactions such as messaging and access to content, supplied 72.8% of revenue in 2025. The combined business grew while its subscription component contracted.
This is a different investment proposition from a simple story about accumulating recurring subscriptions. The accounts suggest a greater dependence on repeated transactional spending. They do not reveal how much comes from individual product features, how concentrated spending is among customers or how much work each additional transaction requires from creators. Those omissions matter. A business whose revenue grows through frequent purchases needs scrutiny of purchase frequency, customer retention, refunds and the concentration of spending, alongside its headline user count.
There is a second complication. Revenue rose 9.9%, but net profit increased only 0.2%, to $521.4 million. Administrative expenses rose 24.4%; the pre-tax margin fell from 48.4% to 46.0%, and the tax charge increased. The company remained highly profitable and paid $535 million in dividends during the year. Yet the direction of earnings is more nuanced than the direction of sales. Rapid monetisation does not automatically produce equally rapid growth in distributable economic value.
For creators, the missing distribution is at least as important as the disclosed total. Fenix reported 5.063 million creator accounts and 437.133 million fan accounts at year-end. Its definition includes accounts created and not subsequently deleted or deactivated. These are account stocks, not a count of full-time workers, paying subscribers or people earning a sustainable income. Dividing aggregate creator proceeds by the account stock would manufacture an average with an unstable economic meaning. It would tell us little about the median, working hours, costs, taxes or dependence on a small number of customers.
This is a familiar platform problem with unusually personal stakes. Creators supply much of the production effort, promotion and reputational exposure; the intermediary supplies infrastructure, distribution, payment processing and rules. An individual can leave with skills and perhaps an audience, but cannot necessarily take the platform's discovery system or payment relationships along. The relevant labour question is the strength of that person's outside option. Revenue participation can coexist with weak bargaining power, especially when the income distribution and the cost of acquiring customers remain opaque.
Digital work can also change physical risk. If some consumers substitute online content for in-person encounters, the effect could reduce exposure to infection. If online services complement physical encounters, the mechanism differs. The direction and magnitude require evidence about substitution, not a moral assumption about technology. This is one reason to keep the digital-content business separate from the disease statistics even while examining both within the broader economics of sexuality.
Geography adds another layer. The Fenix accounts disclose $965.4 million of revenue from the United States, $346.8 million from the UK and Europe combined, and $241.1 million from the rest of the world. The US therefore contributed 62.2% of recognised revenue. The European category grew 22.2%, faster than the total. But the accounts do not split that category into France, Italy, Germany or other individual markets. Country rankings inferred from website traffic would introduce assumptions about spending per visitor that the accounts do not verify.
Grindr illustrates the adjacent economics of matching and attention. Its 2025 results show $439.9 million of revenue, $195.6 million of adjusted EBITDA and $94.8 million of net income. The respective margins were 44.5% and 21.5%. Adjusted EBITDA excludes items including stock-based compensation, which amounted to $54.5 million. A valuation based on the larger margin needs to account for those exclusions and their implications for shareholders. Grindr is a dating and social platform; these results are evidence about a neighbouring market, not a measure of commercial sex. [4]
It is possible to see the economic activity of physical sex services through a different accounting system. In October 2026, Italy's Istat estimated household consumption of prostitution services at €5.0 billion in 2024 and associated value added at €4.2 billion, both up 2.8% on the underlying unrounded estimates. These are modelled national-account quantities, not audited industry sales or profits. The methodology relies on assumptions about the number of workers, transactions, days worked, prices and intermediate costs. [5]
The distinction between consumption and value added is essential. The €4.2 billion is the contribution after intermediate inputs; it is not an additional market to be added to the €5.0 billion. Nor does inclusion within national accounts amount to a welfare assessment or a legal judgment about every transaction. Italy's estimate makes an activity economically visible. It cannot, by itself, establish the distribution of earnings, the conditions of work or the cost of harm.
GDP can increase when a service is purchased and again when medical treatment is needed. That accounting fact does not mean both expenditures increase welfare by the same amount. A successful prevention programme can reduce future medical activity while improving people's lives. Judging the system by revenue or measured output alone therefore rewards visibility rather than wellbeing. The missing question is what participants and society gain after the full costs and risks are considered.
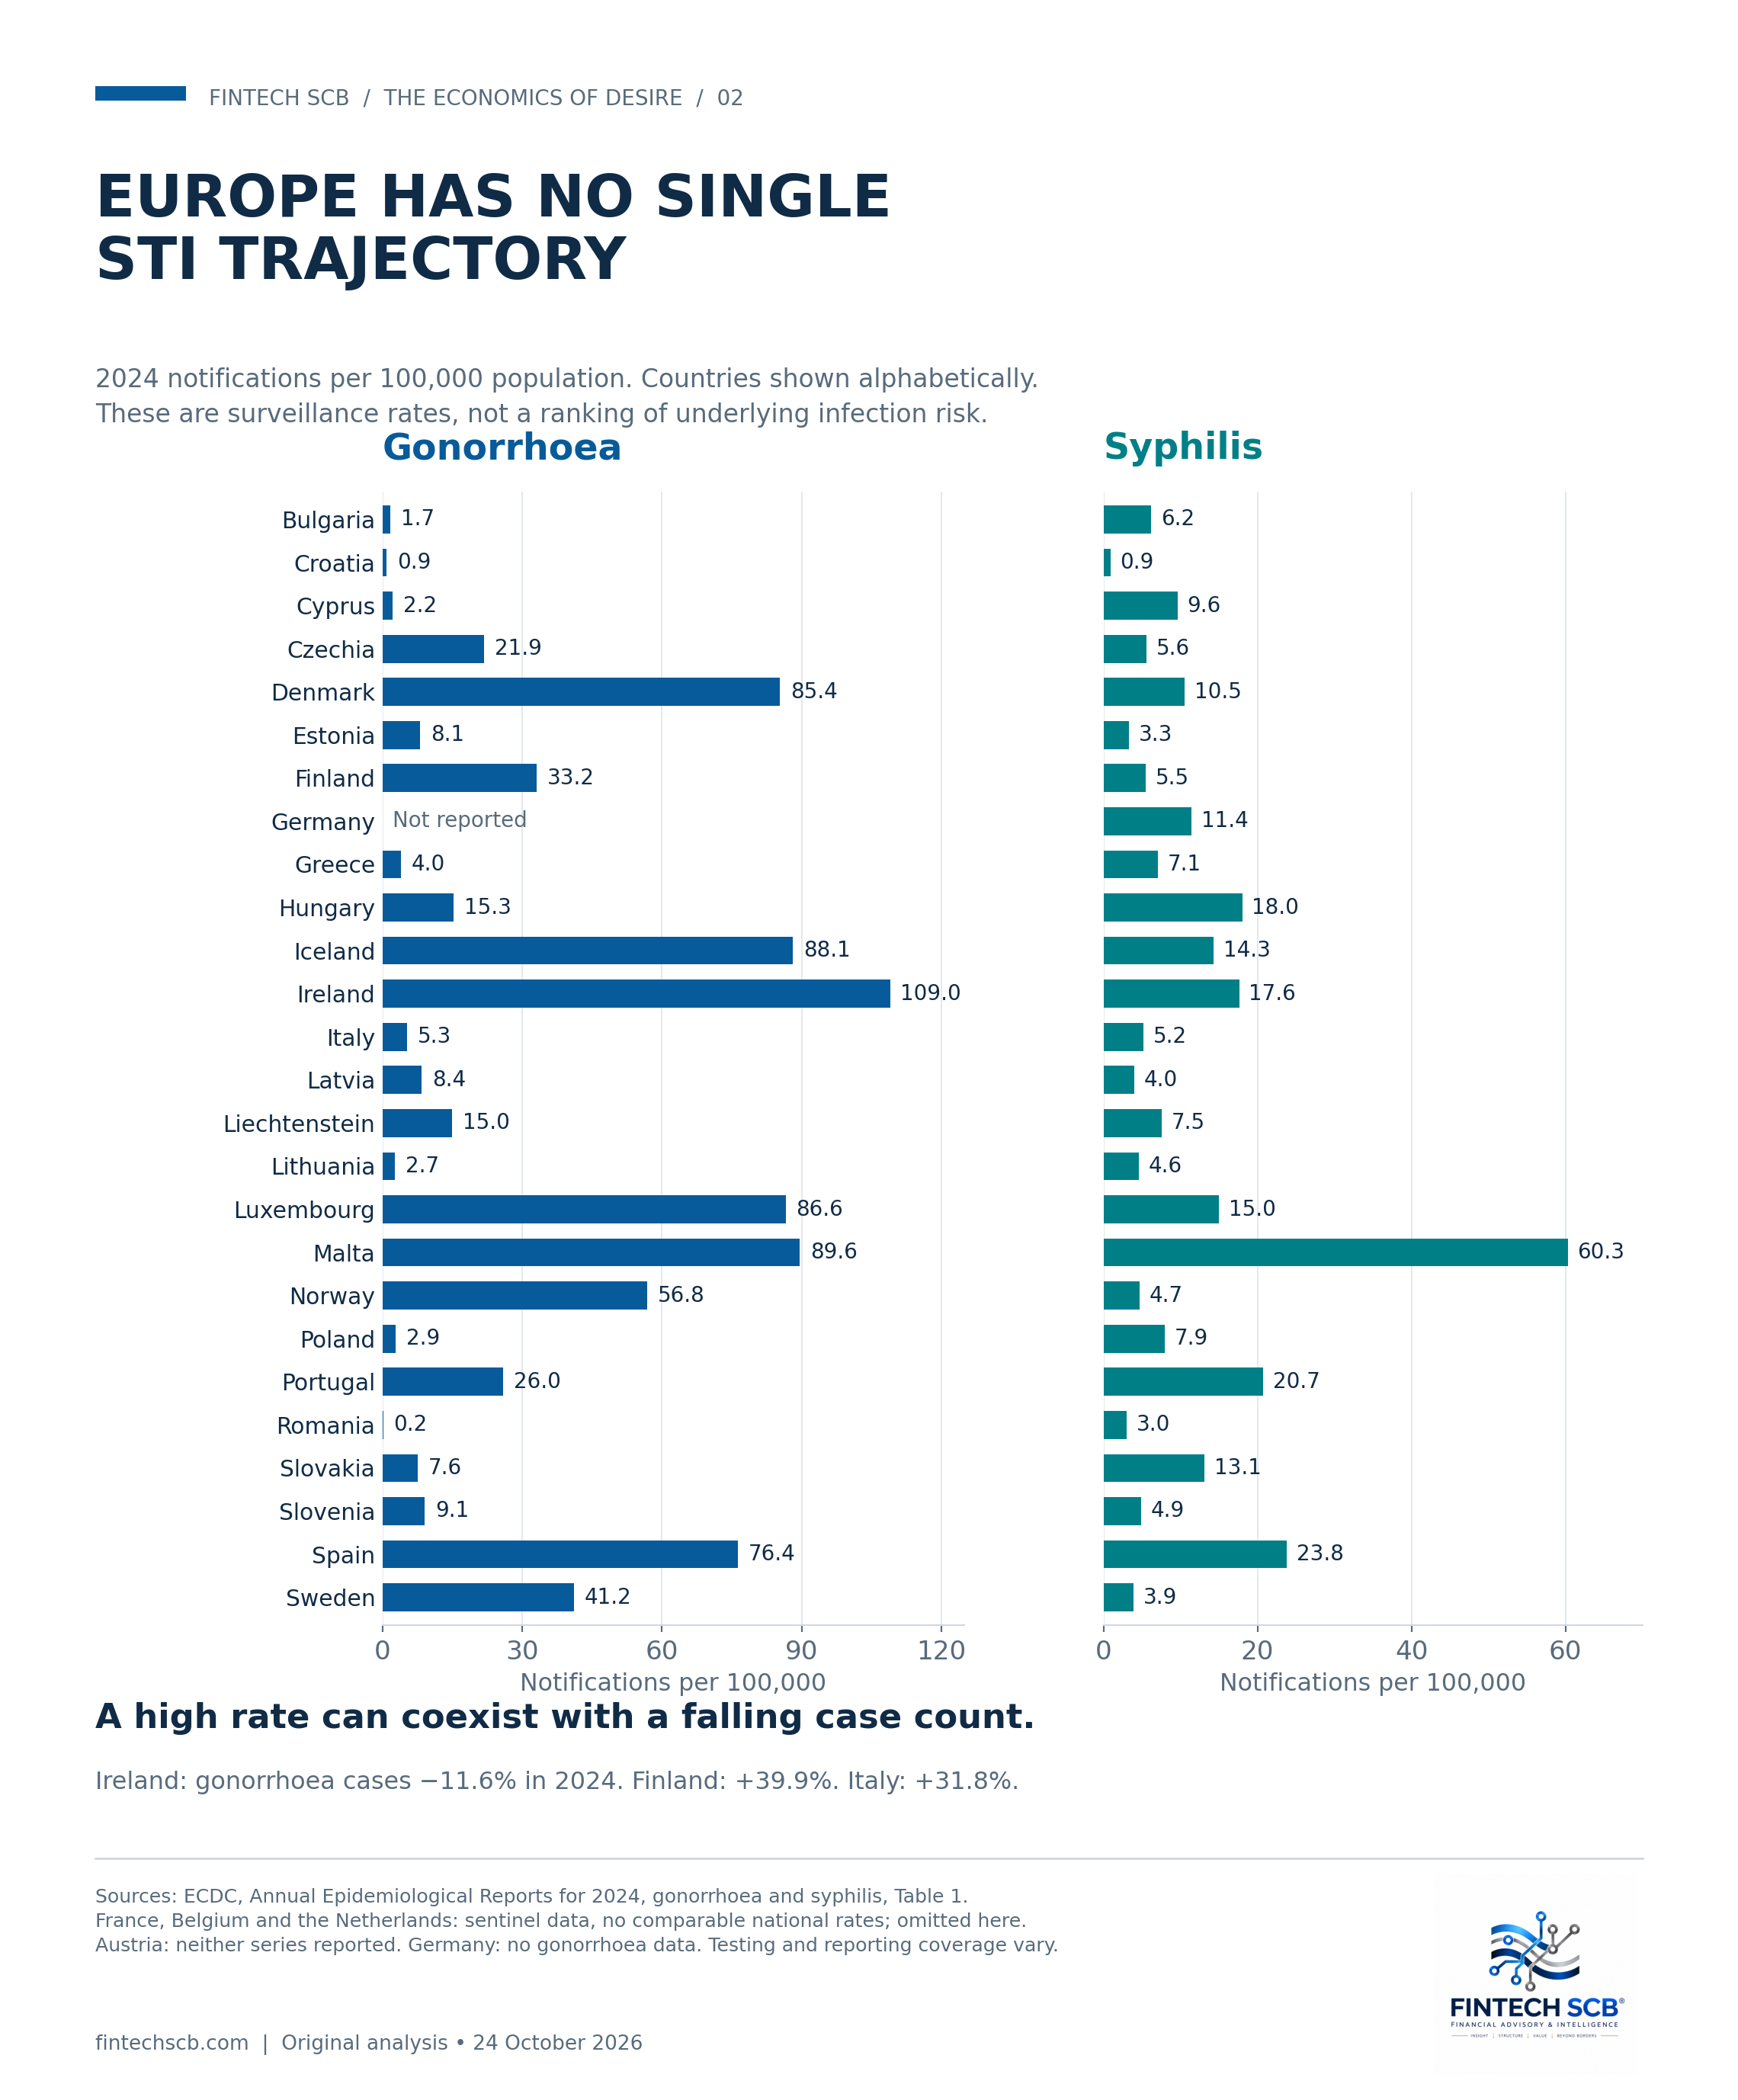
The country evidence makes that question harder, and more interesting, than a single European epidemic headline suggests. ECDC recorded 106,331 gonorrhoea notifications and 45,577 syphilis notifications for 2024. The headline gonorrhoea notification rate was 26.9 per 100,000 population. These are reported diagnoses under participating surveillance systems. Detection depends on access, testing intensity, the people tested, laboratory practice and reporting completeness as well as underlying transmission. [6, 7]
Spain reported 37,169 gonorrhoea cases and 11,556 syphilis cases in 2024, corresponding to notification rates of 76.4 and 23.8 per 100,000. Both counts increased from 2023. Portugal's gonorrhoea count was almost unchanged, at 2,764, while syphilis rose from 1,894 to 2,198. Even neighbouring countries therefore require different diagnostic questions. The composition of the increase matters for testing, partner services, clinical capacity and expenditure.
Ireland had the highest reported national gonorrhoea rate in the ECDC table, at 109.0 per 100,000. Yet its case count fell 11.6%, from 6,598 to 5,832. Denmark also recorded a decline. A high level and an improving annual trend can coexist. A minister rewarded solely for moving down a country ranking could misunderstand both the country's baseline and the role of its detection system.
Finland presents a particularly clear divergence: gonorrhoea notifications increased 39.9%, from 1,329 to 1,859, while syphilis notifications fell 33.0%, from 461 to 309. Sweden reported a modest gonorrhoea increase and a substantial syphilis decline. A single composite STI growth rate would obscure which problem is becoming more urgent. Managing these epidemics resembles managing a portfolio of different exposures, except the units are people and the objective is health rather than a financial return.
Italy's ECDC notifications increased from 2,355 to 3,105 for gonorrhoea, up 31.8%, and from 2,540 to 3,088 for syphilis, up 21.6%. Hungary's syphilis count rose 42.8%, to 1,725. Malta's rose from 124 to 340, a 174.2% increase. Malta's 60.3 per 100,000 rate deserves attention, but its small population also makes percentage movements more sensitive to comparatively small changes in case numbers. These are signals to investigate local transmission and detection, not a league table of sexual behaviour.
France, Belgium and the Netherlands create a different problem. Their ECDC figures come from sentinel surveillance, and the tables do not provide comparable national notification rates. Germany reported syphilis but no gonorrhoea data to this ECDC collection; Austria supplied neither in these tables. A blank cell represents an information gap. It cannot be converted into zero disease or evidence that a country is safer. The chart accompanying this article preserves those gaps rather than estimating them away.
England's newer data complicate the story further. In 2025, gonorrhoea diagnoses fell from 71,766 to 63,943, down 10.9%, and infectious syphilis diagnoses fell from 9,553 to 8,262, down 13.5%. Recorded sexual-health screens were almost unchanged. However, infectious syphilis among women who have sex with men rose from 838 to 878. The overall improvement therefore coexisted with deterioration in a subgroup relevant to pregnancy and congenital infection. England is also a distinct reporting geography and this is a later year than the EU/EEA comparison. [8]
In the Netherlands, sexual-health centres changed routine chlamydia testing in January 2025, generally restricting it to people with symptoms or a partner with relevant symptoms. RIVM explicitly warns that subsequent chlamydia diagnosis totals are not directly comparable with previous years. Meanwhile, gonorrhoea diagnoses at those centres rose from 13,952 to 14,297. A reduction in diagnoses following a change in whom a service tests cannot automatically be booked as prevention success. [9]
The United States provides a similar warning about aggregates. Provisional CDC data for 2024 showed more than 2.2 million reported cases across chlamydia, gonorrhoea and syphilis, with the combined count down 9%. Congenital syphilis nevertheless increased again, to nearly 4,000 cases. The system can improve on a large aggregate while failing on an outcome with particularly serious lifelong consequences. An economic assessment must weight severity and distribution, not simply count events. [10]
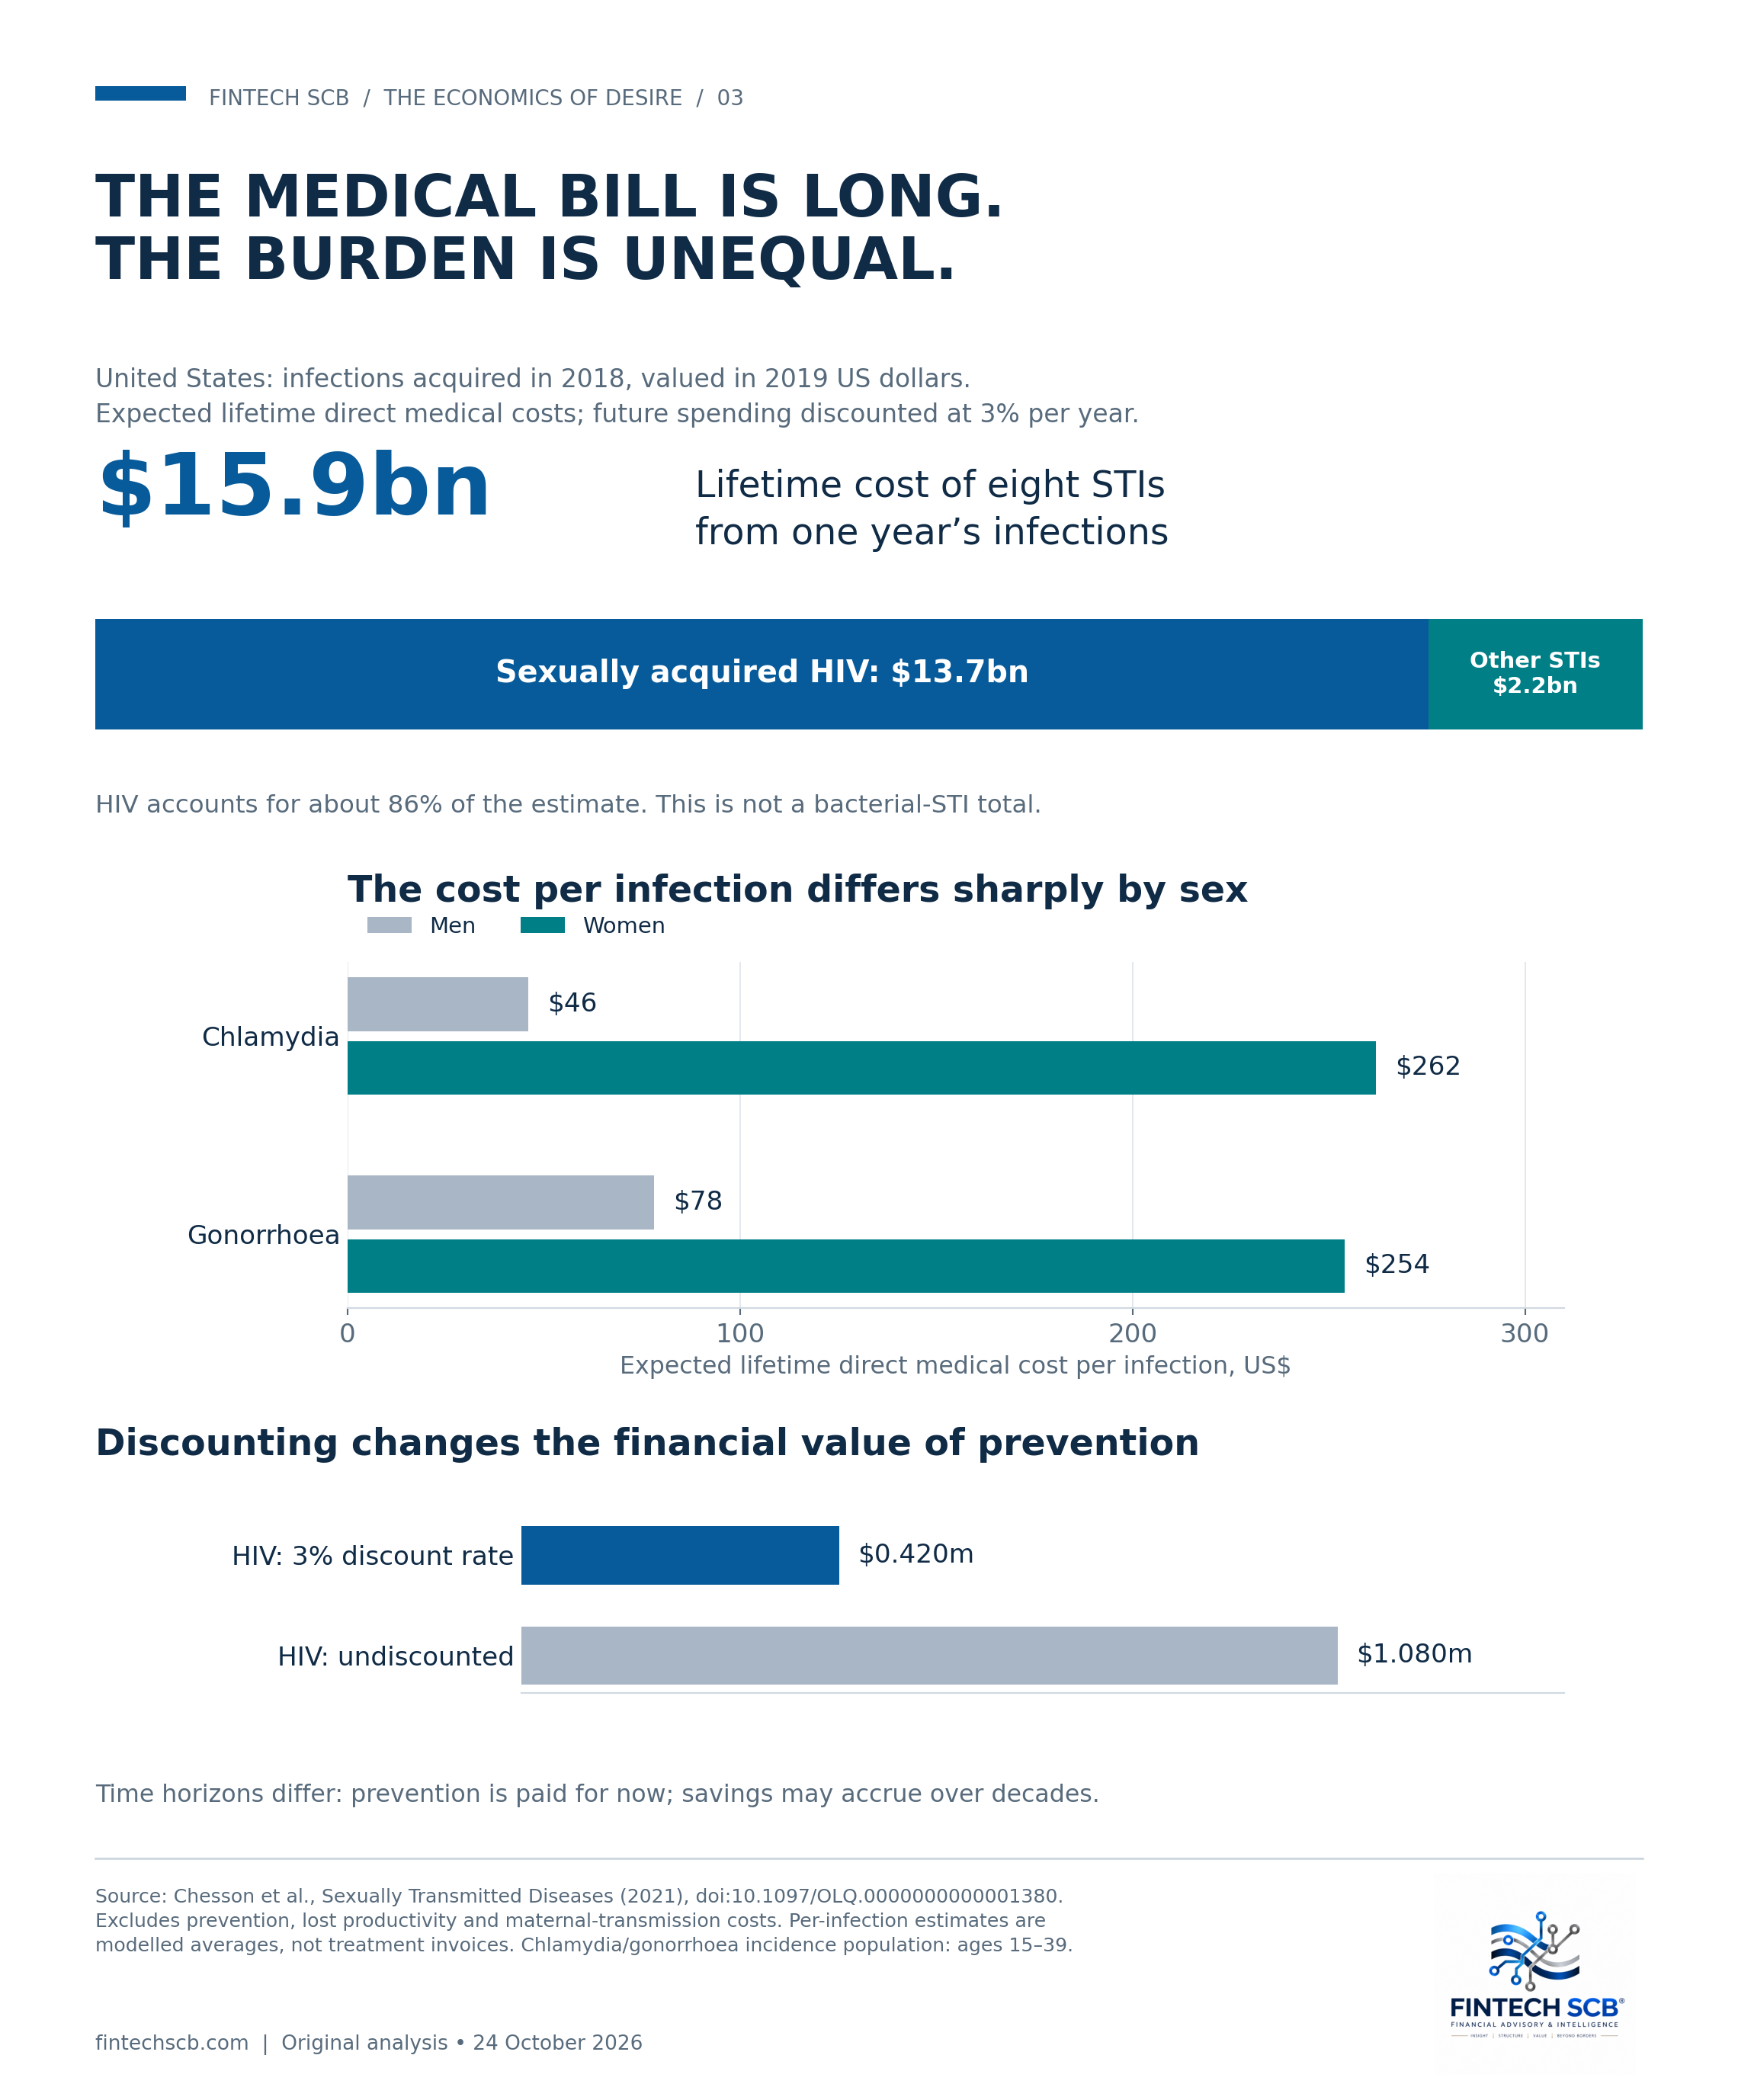
How large is the financial burden? A widely used CDC-authored study estimated that eight STIs acquired in the United States in 2018 generated $15.9 billion in discounted lifetime direct medical costs, expressed in 2019 dollars. The study included sexually acquired HIV, which accounted for $13.7 billion, or approximately 86% of the total. It excluded prevention expenditure, lost productivity and costs associated with maternal transmission, such as congenital syphilis. [11]
The date and accounting basis belong in the headline. This is the present value of future medical costs arising from one year's infections. It is not a measured annual bill for 2026, not a global estimate and not the cost of the three bacterial infections alone. Putting it next to an annual platform revenue figure may illustrate scale, but dividing the two would not establish a subsidy or the share of harm caused by that platform. The populations, periods and causal boundaries differ.
The same study reveals a distributional imbalance. Excluding HIV, women bore approximately three-quarters of the estimated direct medical cost. Expected lifetime cost per infection was $262 for chlamydia in women versus $46 in men, and $254 versus $78 for gonorrhoea. Those averages reflect probabilities of treatment and complications; they are not the bill charged for every diagnosis. The implication is that the person represented most prominently in notification statistics need not be the person bearing the largest downstream cost per infection.
The social burden extends beyond the costs that fit medical claims. Pain, infertility, disrupted relationships, time away from paid work, unpaid care and the consequences of stigma can alter a household's finances and opportunities. Some losses can be valued through earnings or healthcare expenditure; others require measures of health and quality of life. Assigning every category a price and adding them together without examining overlap would create a spurious total. Absence from a medical-cost estimate nevertheless does not make these losses economically irrelevant.
Time is another source of distortion. The US cost study used a 3% annual discount rate. Its underlying estimate for the lifetime medical cost of an HIV infection was $420,285 on that discounted basis, compared with approximately $1.08 million without discounting. The difference comes from when expenditures occur. A clinic is funded now; some benefits of preventing infection emerge decades later and may accrue to another insurer or public budget. The institution paying for prevention may capture only a fraction of the benefit it creates.
This is a funding problem as much as a medical problem. Annual budget control can favour postponing an expense even when postponement increases society's expected costs. Equally, a prevention programme can improve health without reducing total public expenditure. “Cost-effective”, “cost-saving” and “profitable for the provider” describe different tests. A serious investment case needs to specify the perspective, time horizon, discount rate, expected health outcomes and which organisation actually receives any financial savings.
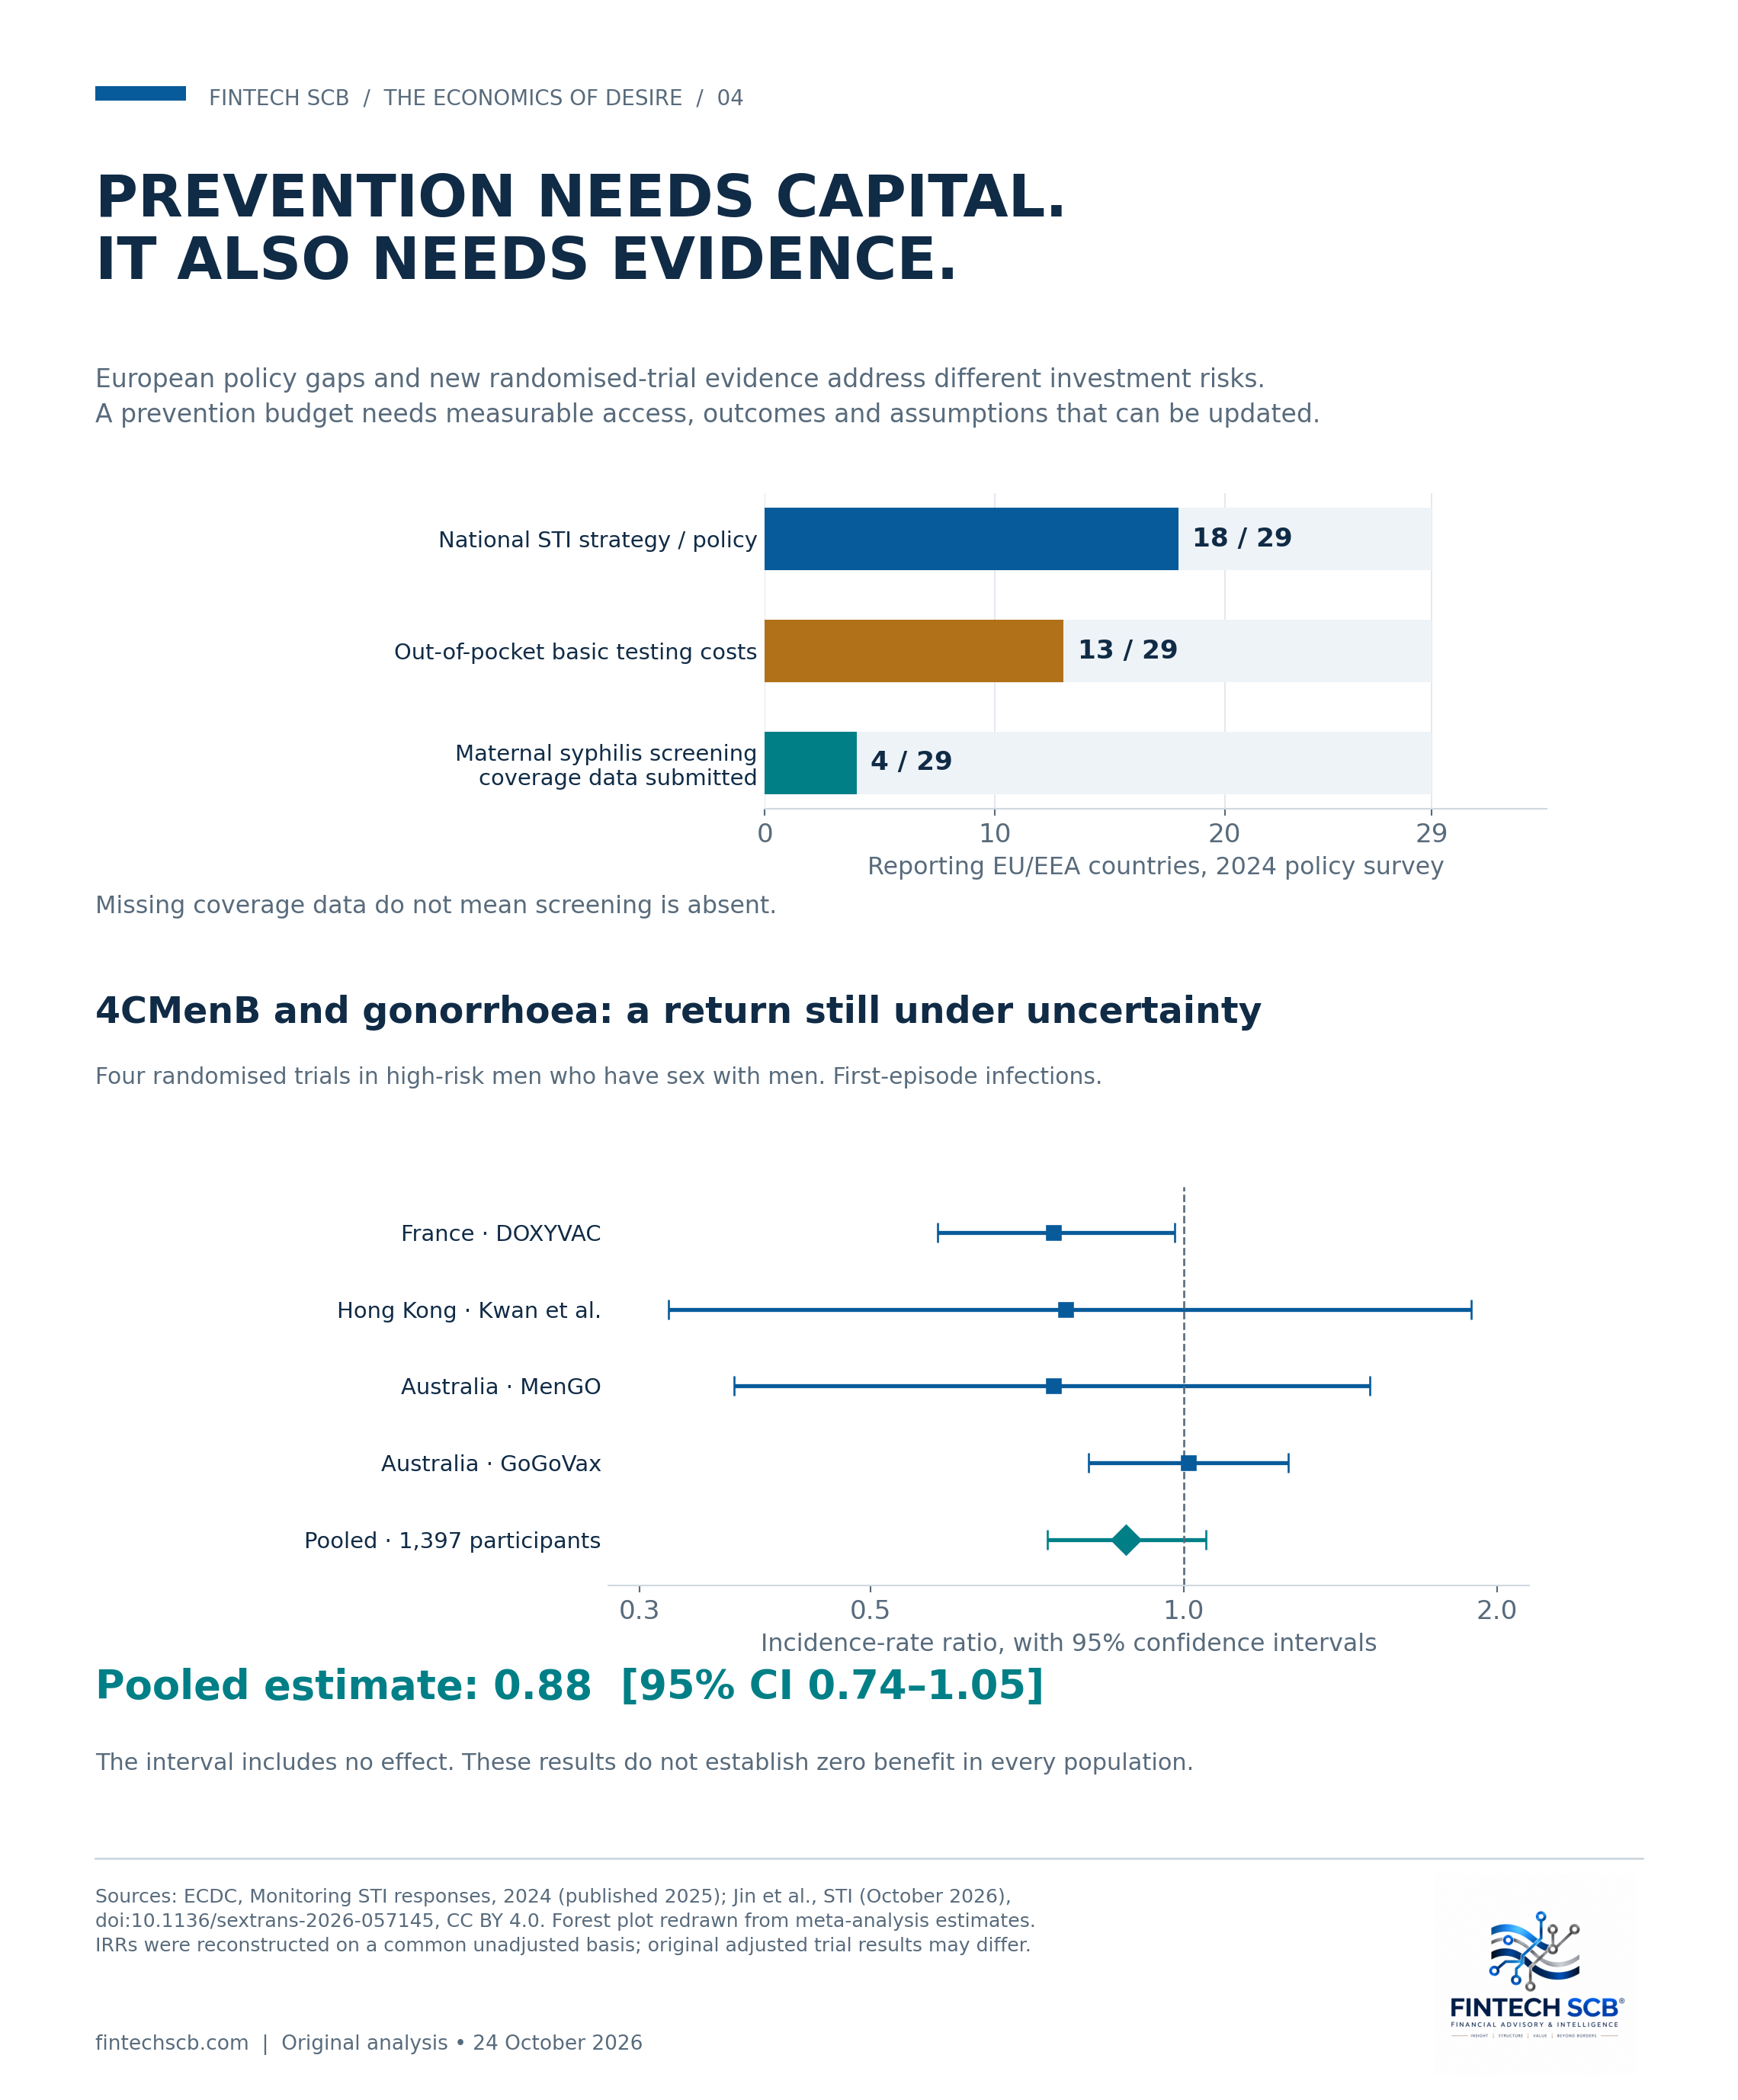
ECDC's policy monitoring exposes how basic some of the missing infrastructure remains. Among 29 reporting countries, 18 had a national STI strategy or policy, 13 reported out-of-pocket costs for basic tests, and only four submitted data on the proportion of pregnant women screened for syphilis. That last figure measures an information gap, not proof that the other countries fail to screen pregnant women. But a policy whose coverage cannot be measured is difficult to manage or evaluate. [12]
For a person facing a fee, travel time, lost earnings or fear of disclosure, testing has a price even when the laboratory procedure is inexpensive. Economic theory predicts that increasing the private cost can deter use. Because diagnosis and treatment can also benefit future partners, the social return to access may exceed the private return perceived by the person paying. The case for reducing barriers rests on that mechanism and should be tested against local service data, rather than assumed to produce the same return everywhere.
The Economist also points to uncomfortable evidence about regulation. Returning to the original research makes the scale clearer. Cunningham and Shah's study of the unexpected decriminalisation of indoor prostitution in Rhode Island found an expansion of the market alongside an approximately 30% reduction in reported rape offences and a reduction of more than 40% in female gonorrhoea incidence. This is a specific quasi-experimental result; it does not establish that every legal reform would have the same effects in every country. [1, 13]
Research by Cameron, Seager and Shah in East Java, Indonesia, examined an unexpected local criminalisation of sex work. Biologically measured STIs among female sex workers increased 58%, with reduced condom access and use identified as the mechanism. The researchers also found economic harm among women leaving the sector and pressure on their children's schooling. These results make it difficult to evaluate enforcement exclusively through arrests, closures or the visible size of a market. [14]
A policy can reduce visibility while increasing vulnerability. If workers lose access to safer venues, healthcare or bargaining power, the cost of refusing an unsafe transaction can rise. That mechanism must be distinguished from the separate obligation to prevent coercion, trafficking and abuse. The economic task is to compare actual outcomes under alternative arrangements, including displacement and unintended effects. A moral objective does not excuse a policy from measurement.
Technology offers another route into prevention. Grindr reports that the Together TakeMeHome programme has distributed more than one million free HIV self-test kits, with nearly half ordered directly through its app. This is a company-reported distribution measure, not an independently established estimate of infections prevented. It nevertheless illustrates how the same infrastructure used to reach customers can help reach people underserved by conventional health services. [15]
The business question is whether that contribution becomes durable infrastructure or remains a discretionary campaign. Public-health contracts could reward verified access, completed testing and linkage to care, while protecting sensitive personal information. Paying only for a kit dispatched would encourage a different outcome from paying for a successfully completed care pathway. Metrics, privacy safeguards and independent evaluation belong in the commercial design from the beginning.
Prevention investment also needs protection from its own attractive narratives. When England began its targeted gonorrhoea vaccination programme in August 2025 using the meningococcal B vaccine 4CMenB, the government cited modelling suggesting up to 100,000 infections and more than £7.9 million in costs could be avoided over ten years. Those were projected outcomes conditional on assumptions about protection, uptake and transmission. They were never realised savings waiting in a bank account. [16]
In July 2026, the Australian GoGoVax randomised trial reported a materially different signal. Among 587 participants in the primary analysis, gonorrhoea incidence was 48.1 events per 100 person-years in the vaccine group and 47.8 in the placebo group. The incidence-rate ratio was 1.01, with a 95% confidence interval of 0.80–1.26. The trial did not demonstrate protection against gonorrhoea in the high-risk population studied. This finding concerns that use and population, not the vaccine's established meningococcal indication. [17]
An October 2026 meta-analysis of four randomised trials, conducted in France, Hong Kong and Australia and including 1,397 men who have sex with men, estimated a pooled incidence-rate ratio of 0.88, with a 95% confidence interval of 0.74–1.05. The interval includes no effect. It also leaves uncertainty about a possible benefit; it does not prove that protection is exactly zero in every population. The distinction between observational findings, trial populations and generalisation is central to the investment decision. [18]
The financial response should be to update the expected return, test the sensitivity of projections to efficacy and reassess implementation as further evidence emerges. It would be equally unsound to retain an optimistic savings forecast unchanged or to treat one disappointing prevention strategy as evidence against prevention generally. Procurement and rollout decisions need an explicit process for incorporating new evidence. Otherwise a forecast can acquire institutional permanence after its assumptions have weakened.
Antimicrobial resistance creates a different kind of investment problem. ECDC's July 2026 assessment described increases in ceftriaxone-resistant gonorrhoea and evidence of local transmission in several European countries. It judged the risk to the general population low at that time and reported that the documented cases had been successfully treated. The concern is the narrowing of effective treatment options and the possibility of more difficult management, rather than a claim that all gonorrhoea has already become untreatable. [19]
Preserving effective antibiotics has option value: it protects choices that may be needed later. Laboratories, culture capacity, resistance surveillance and access to appropriate treatment therefore produce benefits beyond the immediate encounter. Those benefits are difficult to capture in a product-level return calculation. They also require stewardship: an intervention that reduces one infection but increases selection pressure elsewhere needs evaluation across both effects. Attaching the entire global cost of antimicrobial resistance to sexual infections would be another accounting error.
What would a financially serious response look like? It would begin with comparable local measurement: notifications alongside testing volumes, positivity, population coverage and changes in case definitions. It would connect prevention expenditure to completed care, time to treatment, reinfection and congenital outcomes. It would distinguish the budget impact over the next two years from the value of health gains over a lifetime. And it would publish assumptions clearly enough that a disappointing result changes the allocation of money.
Country-specific monetary estimates require another discipline. Multiplying Spain's reported gonorrhoea diagnoses by the American cost per infection would combine notifications with a model of all incident infections, different care prices, different treatment probabilities and a different population mix. It would yield a precise-looking answer to a poorly specified question. A defensible Spanish, Italian or Hungarian estimate would need local incidence assumptions, treatment pathways, complication risks and unit costs. Where those inputs are absent, publishing a national disease count is more informative than presenting an invented national financial liability.
There is nevertheless a useful way to make the investment test concrete. A programme's expected financial benefit depends on how many additional people it reaches, how many infections it actually prevents, the medical costs avoided and when those savings occur. Delivery costs must then be deducted. A test programme can initially increase diagnoses because it finds infections that were already present. That apparent deterioration may accompany earlier treatment and lower future transmission. Evaluation therefore needs a counterfactual and enough follow-up to distinguish detection from prevention.
Consider a deliberately narrow historical benchmark. At the US study's discounted estimate of $420,285 per HIV infection, $1 million in additional prevention spending would need to avert approximately 2.4 infections to offset that amount in direct lifetime medical costs alone. The calculation is arithmetic, not an evaluated programme: it uses 2019 US prices, assumes the full medical saving accrues to the decision-maker and says nothing about the achievable number of infections prevented. Real investment decisions require those missing inputs. Its value is to show why small absolute changes in a high-cost outcome can matter financially, while a large number of low-cost contacts may create little measurable return.
The allocation problem also differs within countries. A falling national total may justify changing the mix of services, but it cannot establish that every local budget should shrink. England's divergence between overall infectious syphilis and diagnoses among women who have sex with men illustrates why the marginal pound should follow unmet need and expected benefit rather than a national average. In a small country such as Malta, stable specialist capacity may be important even when annual case counts fluctuate sharply. Fixed service costs do not fall automatically with the number of reported infections.
For investors in the private businesses, the corresponding discipline is to look beyond traffic and headline margins. Revenue concentration, dependence on payment infrastructure, creator retention, compliance costs, privacy and the credibility of adjusted earnings all affect the durability of cash flows. A valuation that capitalises today's profit margin indefinitely embeds a strong claim about future competition and costs. Fenix's slower profit growth and changing revenue mix show why that claim deserves scrutiny. For governments, the comparable questions concern access, coverage, evidence and which budget captures the benefits. These are different balance sheets, but both are damaged by treating an incomplete metric as the whole business.
The strongest conclusion from putting The Economist's two subjects together is therefore an institutional one. We have built highly capable systems for monetising desire and uneven systems for measuring and reducing sexual-health risk. Some markets expand while health outcomes improve; some reported epidemics shrink while severe outcomes worsen. Some preventive investments deliver value; others require revision when better evidence arrives. Precision about those differences is what turns a provocative theme into financial analysis.
Sex is economically consequential because it combines valuable services, human agency, unequal bargaining positions and risks that travel beyond the original transaction. The aim should be to make the gains more durable and the costs more visible. We already know how to count a payment. The harder and more valuable task is to account for the person, the future and the institutions left carrying the risk.
Sources and links
[1] The Economist, “The new economics of sex work”, 19 March 2026. Analysis of the supplied excerpts; the supplied screenshots do not contain every intervening paragraph.
https://www.economist.com/finance-and-economics/2026/03/19/the-new-economics-of-sex-work
[2] The Economist, “Sexually transmitted infections are surging in Europe”, 9 August 2026, updated 13 August. Supplied screenshots.
https://www.economist.com/europe/2026/08/09/sexually-transmitted-infections-are-surging-in-europe
[3] Fenix International Limited, consolidated financial statements, year ended 30 November 2025, statement of comprehensive income and notes 4–6. Percentages calculated from reported values.
https://find-and-update.company-information.service.gov.uk/company/10354575/filing-history
[4] Grindr, full-year 2025 results, 26 February 2026. Adjusted EBITDA is a non-GAAP measure.
https://investors.grindr.com/news/news-details/2026/Grindr-Inc--Delivers-28-Full-Year-2025-Revenue-Growth/
[5] Istat, L'economia non osservata nei conti nazionali, anni 2021–2024, 16 October 2026. Pages 6 and 13; growth calculated by Istat from unrounded values.
https://www.istat.it/wp-content/uploads/2026/10/Econonomia-non-osservata-2024.pdf
[6] ECDC, Gonorrhoea: Annual Epidemiological Report for 2024, 2026, Table 1 and surveillance notes.
https://www.ecdc.europa.eu/sites/default/files/documents/gonorrhoea-annual-epidemiological-report-2024.pdf
[7] ECDC, Syphilis: Annual Epidemiological Report for 2024, 2026, Table 1 and surveillance notes.
https://www.ecdc.europa.eu/sites/default/files/documents/syphilis-annual-epidemiological-report-2024.pdf
[8] UKHSA, Sexually transmitted infections and screening for chlamydia in England: 2025 report. England only; infectious syphilis differs from all-stage syphilis.
https://www.gov.uk/government/statistics/sexually-transmitted-infections-stis-annual-data-tables/sexually-transmitted-infections-and-screening-for-chlamydia-in-england-2025-report
[9] RIVM, Sexually transmitted infections in the Netherlands in 2025, 25 June 2026. Sexual-health-centre coverage; a break in the chlamydia testing series.
https://www.rivm.nl/publicaties/sexually-transmitted-infections-in-netherlands-in-2025
[10] CDC, provisional 2024 STI data, release of 24 September 2025.
https://www.cdc.gov/media/releases/2025/2025-cdc-reports-latest-national-data-on-syphilis-in-newborns-and-sexually-transmitted-infections-stis.html
[11] Chesson et al., “The Estimated Direct Lifetime Medical Costs of Sexually Transmitted Infections Acquired in the United States in 2018”, Sexually Transmitted Diseases, 2021. DOI: 10.1097/OLQ.0000000000001380.
https://stacks.cdc.gov/view/cdc/135964
[12] ECDC, Monitoring of the responses to STI epidemics in EU/EEA countries, 2024, published December 2025.
https://www.ecdc.europa.eu/sites/default/files/documents/Monitoring-of-responses-to-STIs-in-EU-EEA-2024.pdf
[13] Cunningham and Shah, “Decriminalizing Indoor Prostitution: Implications for Sexual Violence and Public Health”, Review of Economic Studies, 2018. DOI: 10.1093/restud/rdx065.
https://gspp.berkeley.edu/research-and-impact/publications/decriminalizing-prostitution-implications-for-sexual-violence-and-public-health
[14] Cameron, Seager and Shah, “Crimes against Morality: Unintended Consequences of Criminalizing Sex Work”, Quarterly Journal of Economics, 2021, 136(1), 427–469.
https://gspp.berkeley.edu/research-and-impact/publications/crimes-against-morality-unintended-consequences-of-criminalizing-sex-work
[15] Grindr for Equality, Health. Company-reported programme distribution figures, accessed 24 October 2026.
https://www.grindr.com/g4e/health
[16] UK government, “NHS begins rollout of world-first gonorrhoea vaccine programme”, 4 August 2025. Modelled projections at rollout, not measured outcomes.
https://www.gov.uk/government/news/nhs-begins-rollout-of-world-first-gonorrhoea-vaccine-programme
[17] Seib et al., GoGoVax, New England Journal of Medicine, published online 8 July 2026. DOI: 10.1056/NEJMoa2516739.
https://www.nejm.org/doi/full/10.1056/NEJMoa2516739
[18] Jin et al., “Randomised trials of meningococcal B (4CMenB) vaccination for the prevention of gonorrhoea”, Sexually Transmitted Infections, October 2026. DOI: 10.1136/sextrans-2026-057145. Open access, CC BY 4.0. The accompanying chart redraws the published meta-analysis estimates; original adjusted trial analyses may differ.
https://sti.bmj.com/content/early/2026/10/08/sextrans-2026-057145
[19] ECDC, “Upsurge of ceftriaxone-resistant Neisseria gonorrhoeae with evidence of local transmission”, risk assessment, 16 July 2026.
https://www.ecdc.europa.eu/en/publications-data/risk-assessment-upsurge-ceftriaxone-resistant-neisseria-gonorrhoeae-evidence
Original analysis and charts: FINTECH SCB | fintechscb.com
Originally published on Substack.
Segui Roberto Balbino su Substack