
The restructuring dividend: who gets paid when the workforce gets smaller?
Deloitte’s 45% pay rise, the incentives inside Salesforce’s margin targets, and the question boards should answer before rewarding a transformation.
Roberto Balbino | Fintech SCB
“Our people are our greatest asset” is an easy sentence to publish. A remuneration report is a more demanding place to test it.
The Financial Times reports that Richard Houston’s remuneration at Deloitte increased by 45% to £7.1 million in the financial year ended May 2026, after the firm reduced its UK staff by 1,000. Over the same financial year, UK and Swiss revenue increased by 2%, while distributable profit rose by 14%.[1–3]
The juxtaposition invites an immediate response: people leave, leadership receives more. But the more useful question is how a business decides that a restructuring has created value, and when the people who approved it are entitled to collect the reward.
My thesis is that remuneration can recognize the visible benefit of a workforce reduction before the organization has adequately measured its full consequences. The risk is greatest when savings improve an incentive metric, while some of the costs are excluded, deferred or difficult to observe.
A second issue concerns the allocation of the gain. A larger personal payout can reflect a better operating result, a larger share of that result, or both. Assessing leadership requires separating those channels rather than treating remuneration growth as evidence of productivity.
This is an argument about the design of incentives. It is also an argument about the distribution of economic gains. It does not require assuming that every workforce reduction is wrong, or that every executive receiving a large award has been paid specifically to dismiss employees.
The distinction matters because a criticism that ignores the contract is too easy to dismiss.
Deloitte: read the composition before judging the increase
Houston’s £7.1 million comprised £5.8 million of UK profit share and a £1.3 million one-off award associated with wider European strategic and financial objectives. Deloitte’s own pay report confirms the composition. His responsibilities covered both the UK and the wider North and South Europe organization during the reporting period. The following June, he took responsibility for the new EMEA structure.[1,3]
Calling the entire amount a salary would be inaccurate. A profit distribution to a partner is also different from an equity award valued at the date of grant in a US public company’s compensation table.
The financial measure needs equal care. Deloitte reported £899 million of distributable profit, against £789 million a year earlier. It explains that this measure differs from statutory profit, including because of the treatment of member annuities, pensions and distributable capital profits. Revenue was £5.81 billion, compared with £5.68 billion.[2]
The disclosed median pay ratio rose from 65:1 to 93:1. That measures relative remuneration within the report’s methodology; it does not prove a comparable change in an individual employee’s pay.[3]
The audited group accounts also report £30 million of profit entitlement for key management personnel, compared with £26 million, while their average number remained 14. That is an aggregate increase of approximately 15.4%, not evidence that every individual received the same rise.[12]
These qualifications do not remove the governance issue. They locate it more precisely. How much of the larger distribution reflects additional responsibilities, wider performance, changes in profit allocation, operating improvement or lower employment costs? The public material examined here does not provide a bridge that attributes Houston’s increase to those individual causes.
We should ask for that bridge rather than pretend we already possess it.
[Insert chart 1: FINTECH_SCB_Deloitte_pay_and_performance.png]
Chart 1. Reported rounded growth rates for FY2026. Houston’s remuneration covers wider European responsibilities and includes a one-off award; revenue and distributable profit cover the UK and Switzerland. The juxtaposition does not establish causality.
The second lever: who participates in the profit
The FT’s account of Project Maple, Deloitte’s partnership review, adds an important dimension. According to people familiar with the changes, the initial allocation to new equity partners fell from 100 units to 80. That is a calculated reduction of 20% in initial units. The article explains that unit values fluctuate with the firm’s profit and that individual performance also contributes to each partner’s remuneration.[1]
It would therefore be wrong to translate this directly into a 20% pay cut. Nor does it establish that existing partners lost units, or quantify any benefit to Houston personally.
The same article reports that equity partners’ share of the wider partnership increased from about 54% in 2025 to almost 60%. People close to the firm described an intention to provide a route into equity for more salaried partners, who hold the title but remain employees without an ownership stake.[1]
Both changes can occur simultaneously: access to ownership becomes more widespread while the initial allocation per new owner becomes smaller. Counting equity partners cannot establish whether economic ownership is becoming more or less concentrated. That requires the distribution of units, their value and the performance adjustments applied to each group.
This is the distinction I would add to the debate about executive pay. One set of decisions determines the operating result: revenue, pricing, costs and productive capacity. Another determines participation in that result: ownership allocations, profit-sharing rules and awards. The two can reinforce each other, but they answer different questions.
For a given number of new entrants and unchanged terms elsewhere, allocating fewer units could limit dilution of existing holders. If more people enter equity, however, the total allocation can still expand. We cannot infer the net distributional outcome from the 100-to-80 change alone.
The appropriate disclosure would reconcile the total profit pool, the total units outstanding, allocations to existing and newly admitted partners, the value per unit, and the role of individual performance. It would then be possible to distinguish a larger reward earned through a stronger business from one arising through changed participation rights.
That is a question about the governance of distribution as well as the governance of performance. A firm can improve its results and still owe its people a clear explanation of how the resulting gains are shared.
Why “because they cut jobs” is a claim that must be tested
Three levels of evidence should be kept separate.
Coexistence is the first: pay rises during a period of workforce reduction. This identifies a case worth examining.
A contractual mechanism is stronger evidence: remuneration depends on an operating measure that workforce savings can improve, or a committee explicitly includes restructuring execution in its assessment.
Causal attribution is stronger still: the evidence establishes how much of the award resulted from those savings, after accounting for other performance drivers and the relevant contract terms.
These are different propositions. A photograph of two numbers cannot establish the third.
Kevin Hallock’s historical research provides a useful warning. In a Cornell account of his work, the apparent relationship between layoffs and CEO cash pay disappeared after controlling for firm and executive characteristics. The discussion also distinguishes current remuneration from changes in the value of executives’ equity holdings.[11]
That older evidence does not settle the question for present-day remuneration arrangements. It does show why a collection of striking anecdotes is not a representative causal study.
The stronger challenge is to inspect how each contract translates a business decision into a reward.
Salesforce: the mechanism is in the performance measure
Salesforce’s FY2024 proxy reports Marc Benioff’s total compensation at $39.64 million, versus $29.87 million in FY2023, a calculated increase of 32.7%. Its results release shows year-end full-time-equivalent headcount declining from 79,390 to 72,682, or 8.4%. Revenue increased 11%.[4,6]
The June 2024 proxy supplement explains that non-GAAP operating margin carried half the metric weighting for performance-based restricted stock units. It also describes a second CEO equity award with a $20 million target value, following a review of performance and market positioning.[5]
This is more informative than the headline pay increase. It identifies both a performance measure and a committee decision.
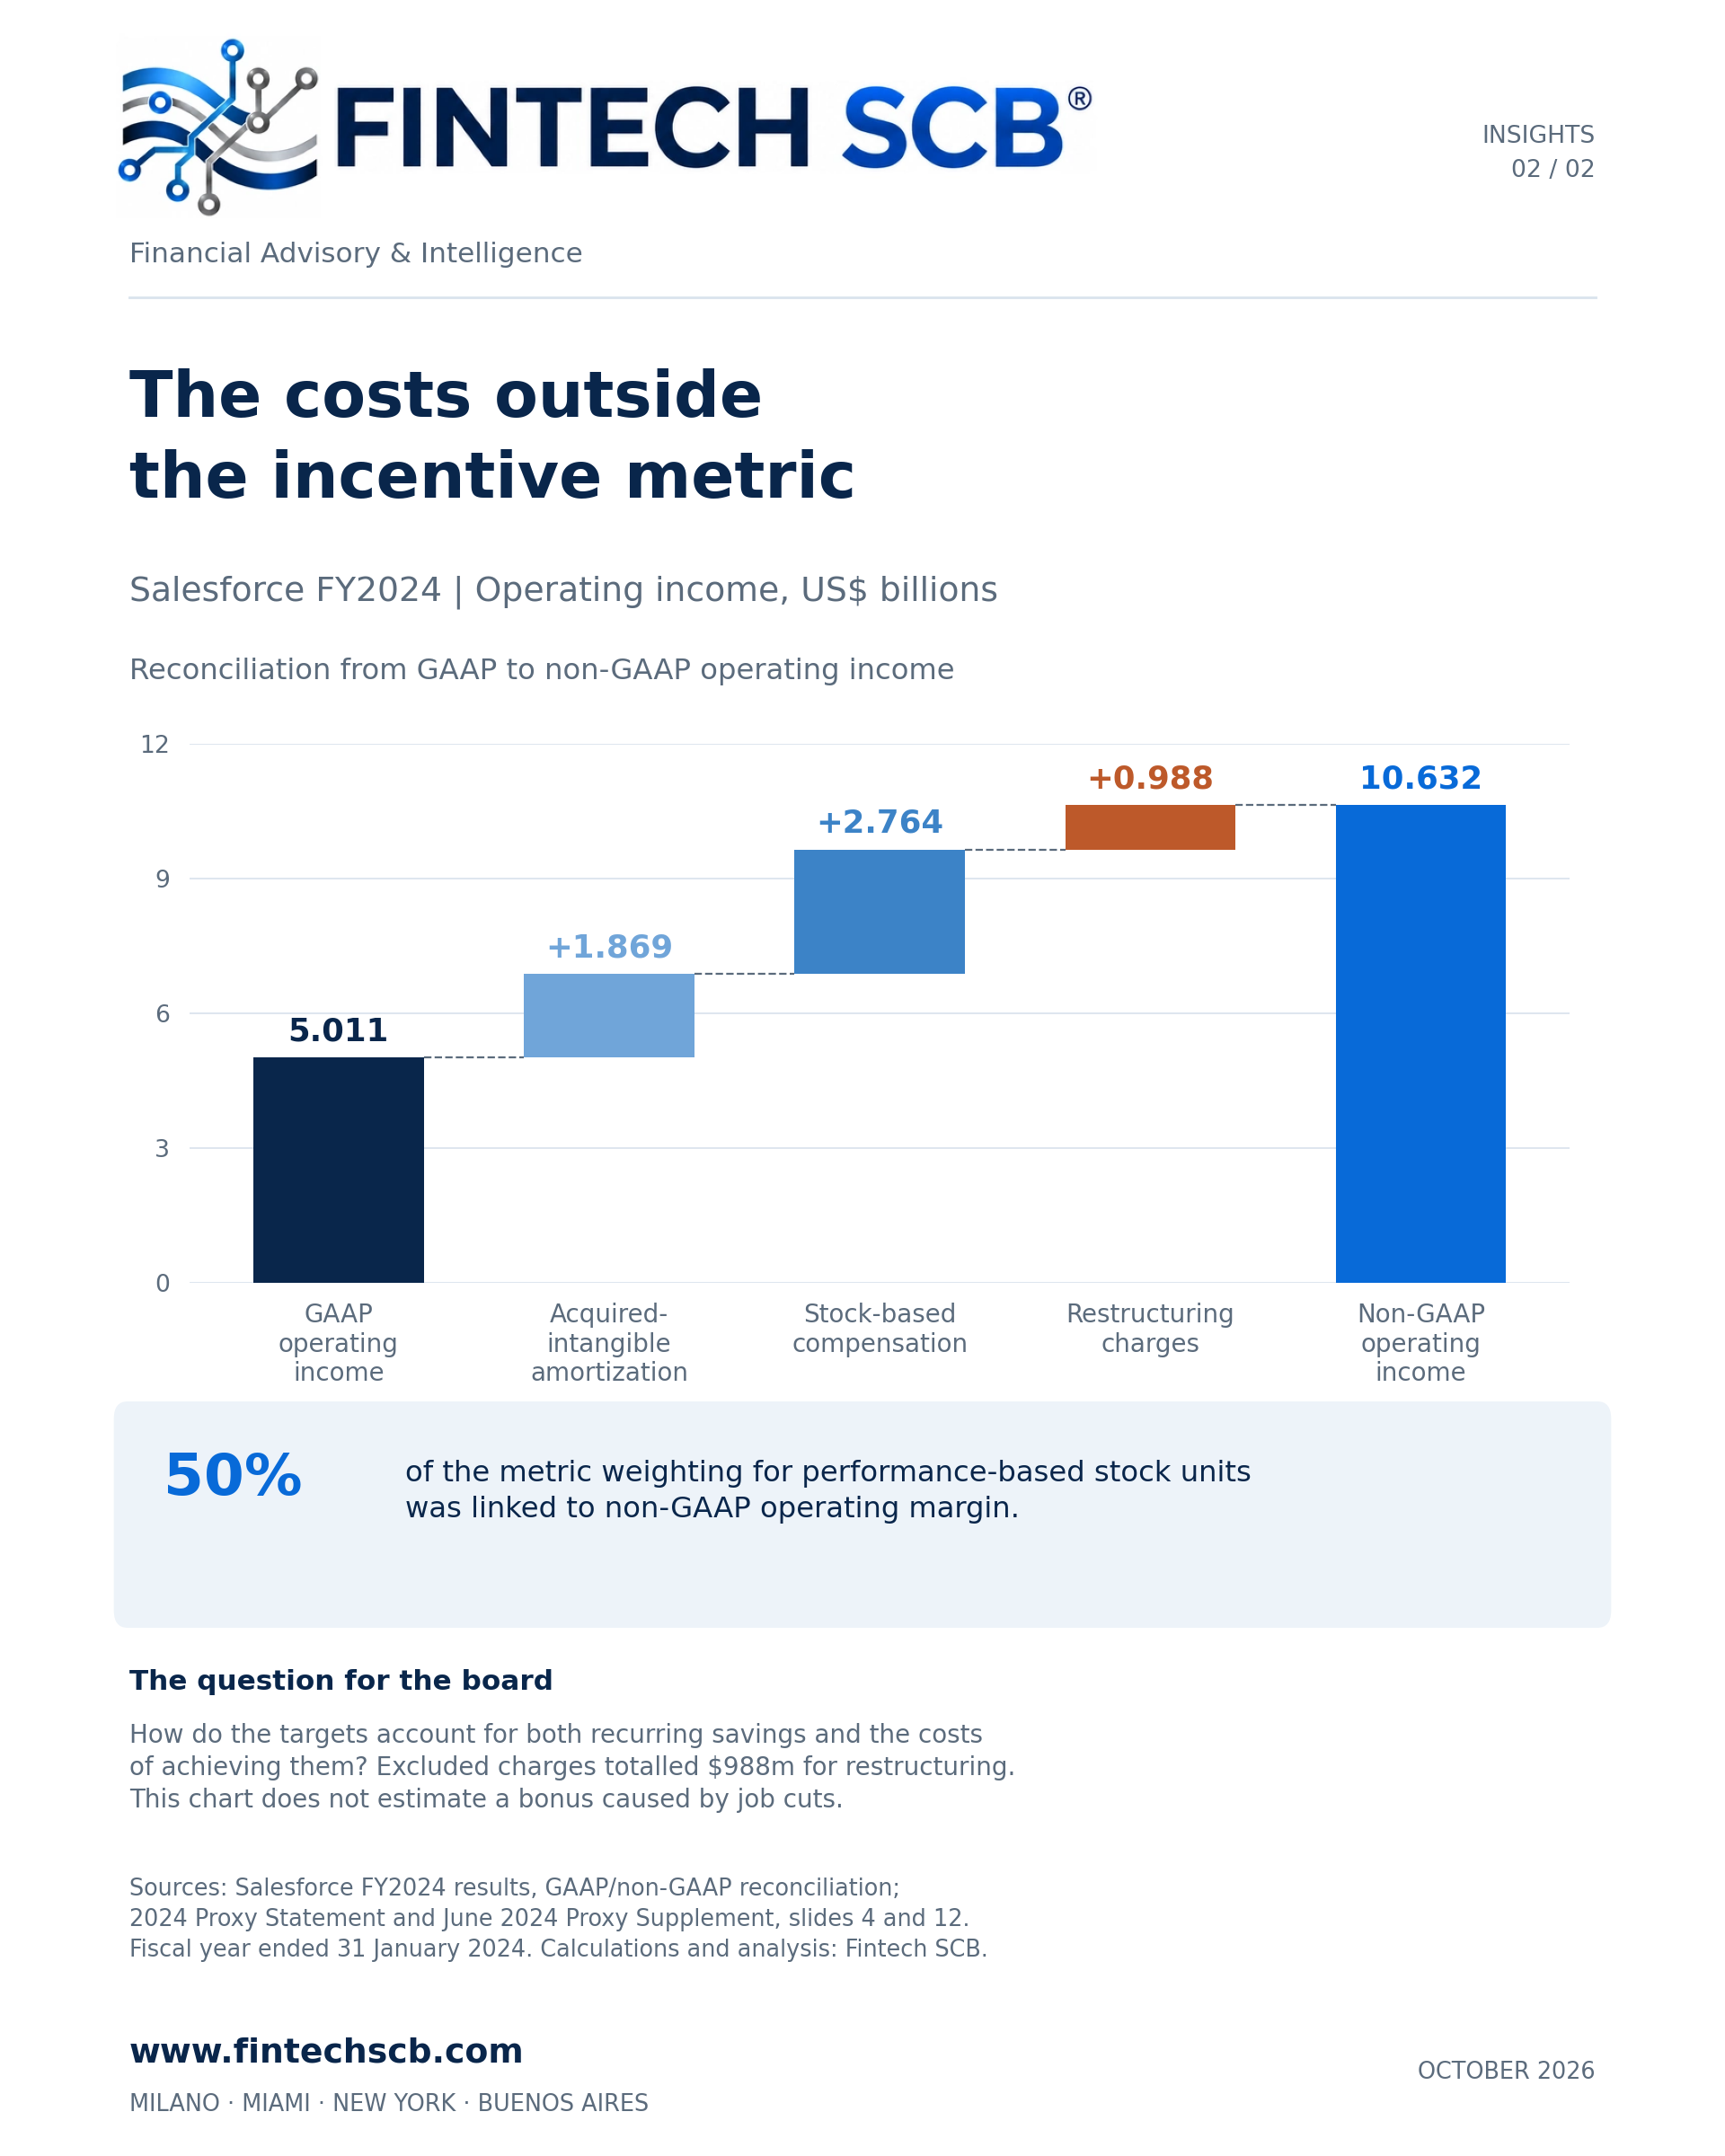
The FY2024 reconciliation moves from $5.011 billion of GAAP operating income to $10.632 billion of non-GAAP operating income by adding back $1.869 billion of acquired-intangible amortization, $2.764 billion of stock-based compensation and $988 million of restructuring charges.[6]
[Insert chart 2: FINTECH_SCB_Salesforce_incentive_metric.png]
Chart 2. Salesforce’s disclosed reconciliation, in US$ billions. The three adjustments explain the difference between the two operating-income measures. The chart does not estimate a bonus attributable to layoffs.
The governance question follows from the design: when recurring employment savings improve a margin, but restructuring charges are excluded from that margin, how has the committee ensured that its target reflects the full economics of achieving the result?
An adjusted measure can be useful. A genuinely unusual expense may obscure the performance of ongoing operations. But a useful investor metric is not automatically a sufficient basis for allocating executive rewards. The target must also be assessed: an exclusion disclosed in advance and incorporated into a demanding target is different from an unexpected adjustment that makes an award easier to earn.
Salesforce’s margin-linked FY2024 tranche produced a 185% annual payout percentage. Crucially, this was a component of a three-year calculation, not an immediate payment of 185% of the CEO’s entire compensation.[4]
That distinction is important. Long-term conditions already exist. The remaining question is whether they test the relevant consequences, and whether performance is attributed accurately.
Citi: the difference between annual pay, a special award and reported compensation
Citi’s 2025 proxy placed Jane Fraser’s annual compensation for 2024 at $34.5 million, compared with $26 million for 2023. Its rationale included organizational simplification, alongside financial performance and other strategic objectives.[7]
For 2025, annual compensation was set at $42 million, up 21.7%. Separately, the board approved a special equity award with a $60 million approved value. It was structured to vest over years three to five, subject to continued employment and specified terms.[8]
The SEC Summary Compensation Table reported $95.76 million for 2025, versus $31.13 million for 2024. Those figures use grant-date reporting rules and include special awards; they are not the same measure as annual compensation awarded for performance, and they are not cash collected in that year.[8]
Citi’s reported full-time workforce fell from approximately 229,000 at December 2024 to 226,000 at December 2025.[9]
The lesson is to resist choosing whichever pay number creates the most dramatic headline. The special award warrants scrutiny on its own terms, including why retention required that amount and what conditions attach to it. Combining incompatible measures would weaken that scrutiny.
Microsoft: the counterexample belongs in the analysis
Microsoft’s FY2026 proxy reports Satya Nadella’s total compensation at $90.63 million, down from $96.50 million: a reduction of 6.1%. Over the corresponding year, full-time headcount declined from approximately 228,000 to 223,000, or 2.2%.[10]
Other executives moved differently. CFO Amy Hood’s reported compensation rose from $29.48 million to $33.72 million, approximately 14.4%.[10]
The company therefore illustrates why workforce contraction is not a mechanical explanation for every executive’s award. Grant values, role-specific decisions and contract design matter. It also shows why “management pay” should not be treated as a single number.
These are selected cases used to examine mechanisms. They do not establish how frequently employers reward workforce reductions across the economy.
The original question: who receives the restructuring dividend?
I use “restructuring dividend” as an analytical description of how the benefits of a restructuring are allocated. It is not a recognized accounting line or a claim that all restructurings produce a distributable gain.
Where a restructuring does improve the business, some combination of executives, owners, retained employees and customers may benefit. Where it fails, some combination of those groups—and departing employees—bears the loss.
The distribution is governed by different arrangements. Ownership and executive awards can provide participation in the upside. An employee whose role is removed may have severance and contractual rights but no continuing participation in the future gains attributed to that decision. Retained employees may receive higher pay, additional investment or greater workloads; the outcome has to be examined, not assumed.
The analytical problem is that benefits and costs arrive on different schedules.
Payroll savings can become visible relatively quickly. A loss of technical knowledge, a weaker control environment, customer dissatisfaction or the need to rehire may emerge over subsequent reporting periods. These are potential consequences, not allegations that they occurred in each company discussed here.
Even a deferred award can have the wrong horizon if the period ends before material risks become measurable, or if the conditions cover share-price performance without adequately assessing the operational outcomes on which the restructuring depended.
Conversely, a well-designed long-term award can make management bear meaningful exposure to those risks. The point is to inspect that exposure rather than assume that all deferred pay is either cosmetic or sufficient.
Professional services make the trade-off particularly visible
In a consulting, accounting or advisory firm, much of productive capacity sits in people: client relationships, judgement, accumulated knowledge and the ability to train the next generation.
A departing employee removes a recurring expense. The same departure can remove part of the capacity that makes future revenue possible. The first effect is easier to budget than the second.
Revenue per employee is therefore a diagnostic measure, not proof of a successful transformation. It can increase because output rises, because headcount falls, because lower-revenue activities are sold, or because work moves to contractors outside the employee count. Each explanation has different implications.
The same discipline applies to AI. If payroll savings require additional spending on software, cloud infrastructure, specialist staff or external providers, the economics should include those costs. A change in the location of expenditure is not, by itself, evidence that the work has become cheaper or better.
The appropriate question is whether the organization can sustainably deliver more value for the resources it consumes, with acceptable service quality and risk.
There is also a question of accountability across the full cycle. If the leadership team approved an expansion and later reverses it, the board should distinguish a justified response to new information from the correction of an avoidable mistake. Otherwise, the same sequence can generate praise for growth and another award for undoing it, without a clear assessment of the combined result.
A practical test for remuneration committees
I would require a separate, explicit reconciliation for any material reward that the committee attributes to restructuring. Its purpose would be to test durability and attribution, not to prevent necessary change.
First, establish the baseline. Identify what the business was expected to achieve without the restructuring, the assumptions behind that expectation, and the alternatives considered. Avoid attributing improvements from market recovery, pricing, currency movements or acquisitions to workforce cuts.
Second, measure the net benefit. Report savings alongside severance, implementation, incremental technology, outsourcing and rehiring costs. Use a consistent time horizon, reconcile overlaps, and avoid counting the same benefit twice. Where an item cannot be measured reliably, disclose the uncertainty rather than assign a convenient zero.
Third, test the operating outcome. Select measures that fit the business: customer retention, delivery performance, quality, control deficiencies, service backlogs, regretted attrition and the resilience of critical teams. A margin improvement accompanied by persistent deterioration in the relevant measures requires explanation.
Fourth, align the award with that evidence. Specify in advance what portion depends on restructuring benefits, how long the relevant outcomes will be assessed, and what would reduce or cancel the award. Existing deferral, malus and recovery provisions should be examined for what they actually cover. A provision addressing an accounting restatement may not address an economically disappointing restructuring that was accurately reported.
Fifth, explain the distribution. Show how executives and owners benefit, what support departing staff receive, and whether retained employees share in productivity gains. In a partnership, show changes in participation rights as well as the number of partners: broader admission does not, by itself, describe the allocation of economic ownership. Disclosure does not require every group to receive an identical outcome. It makes the allocation visible and allows the board to defend it.
This is a proposal, not a claim that current rules universally require these steps or that the companies discussed lack all of them.
The test should permit a large award when a difficult reorganization demonstrably preserves a viable business, improves its capacity and creates enduring value. It should also make it harder to reward an improvement that survives only until the next operating problem becomes visible.
What boards should be willing to show
There are circumstances in which reducing headcount protects the remaining organization. Refusing to adapt can destroy more jobs later. Any serious account of restructuring has to allow for that possibility.
There are also circumstances in which a financial target rewards the immediate appearance of efficiency while leaving future managers, customers and employees to absorb the consequences. An attractive first-year result cannot distinguish these cases on its own.
The FT report is a useful starting point because the numbers are striking. The lasting issue is the evidence required before a board declares the transformation a success and attributes a reward to it.
My standard is simple: demonstrate the net benefit, test its durability, and disclose who receives it.
Before celebrating the savings, show what survived them.
Educational analysis. This article does not make investment recommendations.
Sources and methodology
Research checked on 27 October 2026. The complete FT article body was read through the reader-supplied screenshots, including the additional images supplied after the first draft. Direct web access to the FT page was unavailable. Financial periods are identified individually; FY2024 Salesforce is a historical example, not a claim about its current workforce. Percentage changes were calculated from disclosed figures except Deloitte’s chart, which uses the reported rounded growth rates. The 20% reduction refers to initial units allocated to new equity partners, not remuneration. Net headcount changes include the effects of hiring, departures and potential perimeter changes and are not equivalent to involuntary layoffs. Selected examples do not establish population-wide causality. The Project Maple details are attributed to the FT’s reporting; other numerical and remuneration claims were cross-checked against the primary documents identified below. Analysis and proposals are the author’s interpretation.
[1] Financial Times, “Deloitte boss gets 45% pay rise as firm cuts jobs”, 26 October 2026. Full article body supplied by the reader in screenshots and read in sequence. Company reports cross-check the financial and pay figures; the new-partner unit allocations and Project Maple details are attributed to the FT’s sources.
https://www.ft.com/content/38eb5a47-0d36-4395-b972-4723998b0b9c
[2] Deloitte UK, FY2026 results, especially financial scope and footnote 2 on distributable profit.
https://www.deloitte.com/uk/en/about/press-room/deloitte-uk-publishes-2026-financial-results.html
[3] Deloitte UK Pay & Inclusion Report 2026, printed p.11, CEO pay ratio and footnote 16.
https://www.deloitte.com/content/dam/assets-zone2/uk/en/docs/about/2026/deloitte-uk-annual-review-2026-pay-report.pdf
[4] Salesforce FY2024 Proxy Statement, sections on Operating Margin PRSUs, the Summary Compensation Table, and Appendix A-1 (reconciliation).
https://s205.q4cdn.com/626266368/files/doc_financials/2024/ar/salesforce-fy24-proxy-statement.pdf
[5] Salesforce June 2024 Proxy Supplement, slides 4–5 and 11–12.
https://www.sec.gov/Archives/edgar/data/1108524/000110852424000012/crm_2024proxysupplement.htm
[6] Salesforce FY2024 results, dated 28 February 2024; Additional Metrics and GAAP/non-GAAP reconciliation.
https://investor.salesforce.com/news/news-details/2024/Salesforce-Announces-Strong-Fourth-Quarter-Fiscal-2024-Results/default.aspx
[7] Citi 2025 Proxy Statement, annual compensation determination and strategic priorities.
https://www.sec.gov/Archives/edgar/data/831001/000114544325000075/citi4405291-def14a.htm
[8] Citi 2026 Proxy Statement, annual compensation, Special Award and Summary Compensation Table. Approved award values, grant-date values and eventual realized amounts are distinct measures. The approved special award included grants in more than one calendar year.
https://www.sec.gov/Archives/edgar/data/831001/000120677426000185/citi4583461-def14a.htm
[9] Citi 2025 Form 10-K, Human Capital Resources and Management / direct staff.
https://www.sec.gov/Archives/edgar/data/831001/000083100126000011/c-20251231.htm
[10] Microsoft 2026 Proxy Statement, Summary Compensation Table; FY2026 and FY2025 annual reports, Human Capital Resources.
https://www.sec.gov/Archives/edgar/data/789019/000119312526427849/d61756ddef14a.htm
https://www.microsoft.com/investor/reports/ar26/
https://www.microsoft.com/investor/reports/ar25/
[11] Kevin F. Hallock, “Layoffs and Outcomes for CEOs and Firms”, Cornell University ILR, 2013. Historical research discussion; not evidence of a causal effect in the current cases.
https://www.ilr.cornell.edu/sites/default/files-d8/Layoffs_and_outcomes_for_ceos_and_firms.pdf
[12] Deloitte LLP FY2026 audited consolidated financial statements, Related Party Transactions / Key Management Personnel.
https://www.deloitte.com/content/dam/assets-zone2/uk/en/docs/about/2026/deloitte-uk-annual-review-2026-financial-statements.pdf
Originally published on Substack.
Segui Roberto Balbino su Substack