
The Rules Behind Private Credit
Regulation moved the lender
A company needs a five-year loan. Its machines, customers and cash flows have not changed. Yet the institution willing to provide that loan has.
The bank asks for more collateral, a shorter maturity or a different price. A private credit manager offers a bespoke facility, a negotiated covenant package and a relatively quick decision. The transaction is announced as another example of financial innovation.
It may be. But something less glamorous also deserves attention: the rules changed the relative cost of being the lender.
That distinction matters. If private credit expands because it evaluates borrowers better, the economic story is about productivity in finance. If it expands partly because banks face a different regulatory cost, the story also concerns the design of the financial system. Both mechanisms can operate together.
My argument is that private credit should be assessed as part of a connected financing system. Its success cannot be understood solely through fund returns, and its risks cannot be understood solely through the absence of deposits.
The interesting question is what happened to the borrower, the funding promise and the ultimate loss bearer when the loan changed address.
What the new evidence establishes
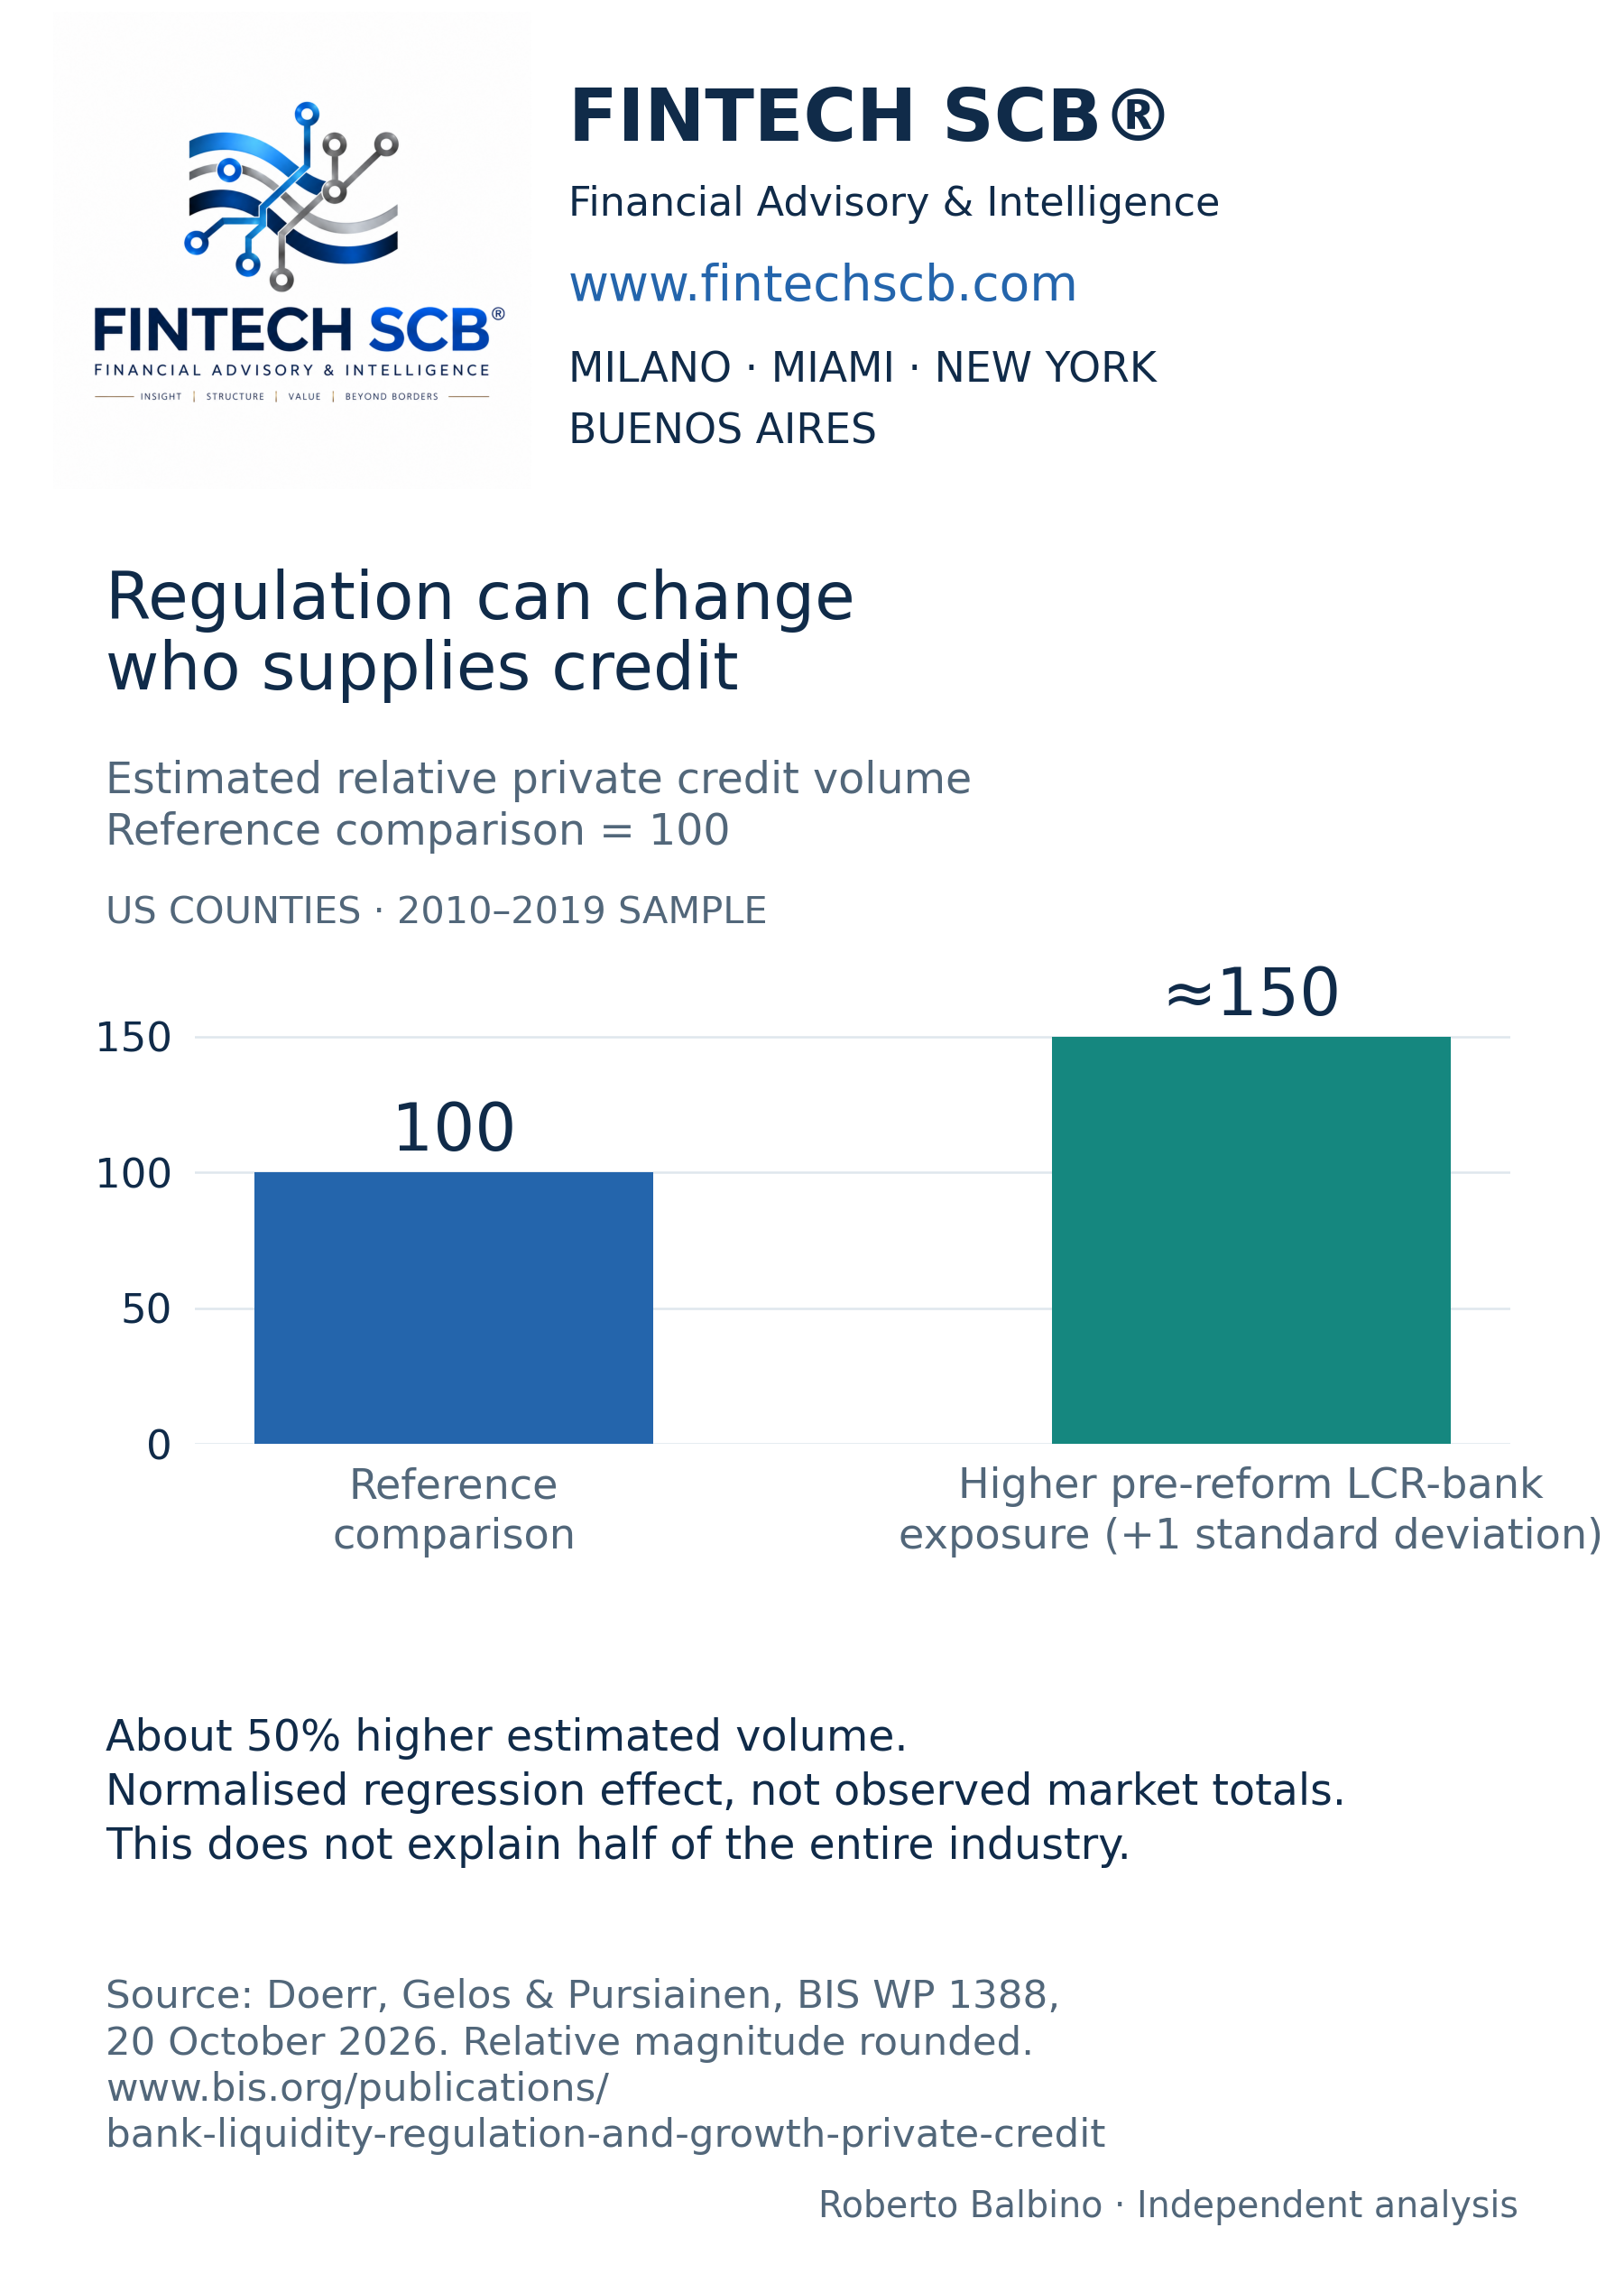
A BIS working paper published on 20 October 2026 examines US counties over 2010–2019. Sebastian Doerr, Gaston Gelos and Vesa Pursiainen find that a one-standard-deviation larger pre-reform footprint of banks subject to the Liquidity Coverage Ratio was associated with nearly 50% higher subsequent private credit volumes in their estimation. The design uses local banking exposure before the reform to study subsequent changes. [1]
This is evidence of a regulatory channel, not an estimate that regulation created half of the entire private credit industry. A county-level result from a historical sample also cannot establish the quality of loans being originated in 2026.
The chart translates that estimated relative effect into an index: a reference level of 100 and approximately 150 for the higher-exposure comparison. These are an illustration of the regression magnitude, not two observed market totals or an investment forecast.
Why a liquidity rule can change a lending decision
The Basel liquidity standard asks banks to maintain high-quality liquid assets sufficient to withstand a specified 30-day stress scenario. It addresses the possibility that funding leaves faster than assets can be turned into cash. [2]
A five-year corporate loan and a highly liquid government security therefore perform different jobs on a bank balance sheet. One finances a business and earns a credit spread. The other can provide liquidity in a stress episode, subject to the applicable rules and market conditions.
A bank must evaluate the return on the loan alongside capital, funding, liquidity, operating costs and expected losses. A borrower may be perfectly worthwhile while the proposed transaction is unattractive at a particular price within those constraints.
This is easier to see in a deliberately simplified example. Assume a bank can earn 7% on a loan, but its combined funding, operating, expected-loss and balance-sheet costs amount to 6%. The margin is one percentage point. If a regulatory constraint raises the transaction’s relevant economic cost by half a point, half that margin disappears. These are illustrative assumptions, not an estimate of the actual cost of the LCR.
The bank might raise its price, change the loan, sell part of it or decline the transaction. Another lender with a different liability structure might accept it. No borrower needs to become suddenly more productive for the financing to migrate.
It would still be a mistake to infer that removing the rule necessarily improves welfare. The additional constraint exists because liquidity failure can impose costs beyond the individual bank. A lower private funding cost is not automatically a lower social cost.
The historical lesson: ask about liabilities
The familiar language of finance divides institutions into banks, funds and insurers. For understanding a crisis, it is often more useful to start with what each institution has promised to pay, and when.
A bank deposit can be callable while the underlying business loan is not. A closed-end fund can commit investors for years. A fund offering periodic redemptions occupies a different position again. An insurer has its own pattern of contractual obligations, policyholder behaviour and asset-liability management.
These differences are economically real. Financing a long-lived, illiquid asset with patient capital can reduce the need to sell it during a temporary panic. It can also give a lender time to negotiate a restructuring that preserves a viable business.
The counterpoint is equally important: time does not manufacture repayment capacity.
A borrower with an uncompetitive product does not become sound because investors cannot redeem. A warehouse full of obsolete goods does not recover its value because the loan is marked quarterly. Patient capital can absorb temporary dislocation; it can also postpone the recognition of a permanent loss.
For that reason, liquidity protection and credit quality belong in separate analytical columns. Combining them into one comforting word, “resilience”, conceals the very issue that needs examination.
The cash-flow test
Consider a hypothetical company with 100 million in debt and 15 million of annual operating cash available before interest, investment and tax. At an 8% cash interest rate, interest absorbs 8 million. At 11%, it absorbs 11 million.
The difference is not merely a 3-percentage-point movement on a financing chart. It is a reduction from 7 million to 4 million in the cash left before the other demands on the business. If maintenance investment requires 5 million, the company now has a funding problem even before paying tax or reducing principal.
The lender has several possible responses. It can extend maturity, change covenants, accept an equity injection, reduce cash interest temporarily or permit interest to be added to the loan balance.
Some of these actions can be sensible. A sound business facing a short disruption should not necessarily be liquidated. But an extension is valuable only if the additional time supports a credible route back to cash generation.
Suppose the lender capitalises 3 million of interest. The borrower keeps that cash today, but owes 103 million rather than 100 million, before other movements. Reported interest income and cash received have diverged. An analyst should track both.
The practical question is whether the financing is bridging a temporary gap or accumulating a claim that the enterprise will never be able to honour.
The bank may still be in the transaction
It is tempting to imagine a clean division: the bank exits and a fund takes over. The architecture can be more complicated.
The FSB’s May 2026 assessment estimated private credit assets at roughly $1.5–2.0 trillion at end-2024 and highlighted connections among funds, banks, insurers and private equity firms. Its evidence also illustrates substantial measurement gaps. The size estimate is historical, not a current October 2026 total. [3]
In a hypothetical chain, an investor commits capital to a fund, the fund lends to a company, and a bank supplies a credit facility to the fund. The bank might also provide hedging or other services. The corporate loan has moved, but parts of the funding and contingent liquidity remain connected to banking.
That need not be dangerous. A senior, well-collateralised facility to a diversified portfolio can have a very different loss profile from a subordinated corporate loan. The analyst nevertheless needs to understand the whole chain.
What happens if several portfolio companies deteriorate together? Can the fund draw a bank line just as the bank is facing demands elsewhere? Are valuations used in financing agreements sufficiently current? Does one sponsor appear repeatedly across different portfolios that are described as diversified?
Those are questions about correlated exposure and timing. They cannot be answered by counting legal entities.
Who receives the premium?
A private loan can compensate investors for several things: credit risk, illiquidity, complexity, the cost of origination and the value of negotiation. Calling the whole yield an illiquidity premium makes the analysis too easy.
Imagine two loans yielding 10%. One finances a conservatively leveraged company with stable cash flow and strong documentation. The other finances an aggressive acquisition with optimistic earnings adjustments. The same headline yield does not purchase the same economic exposure.
Now add fees at different levels of the investment chain. The interest paid by the borrower is not necessarily the net return received by the saver. Management fees, performance fees, financing costs and losses can separate the two substantially.
The useful comparison therefore begins with the net return after realistic losses, adjusted for the period during which capital is unavailable and the confidence one can place in valuations. A smooth reported return series, by itself, answers none of those questions.
The IMF’s April 2024 analysis makes the broader distinction clear: long-term financing can be beneficial, while borrower fragility, valuation uncertainty and interconnections still require scrutiny. Its assessment was made at that time; it should not be recycled as a current clean bill of health. [4]
Why private credit can improve the system
There is a credible positive case.
A specialist lender can understand a niche business better than a standardised credit process. A small lending group can negotiate quickly when a company needs to change direction. Committed capital can support a restructuring without the same redemption pressure faced by some other vehicles.
Competition can also reduce a borrower’s dependence on one bank. That can be valuable when a viable firm has few financing options or when banks are managing a simultaneous balance-sheet constraint.
These benefits are especially plausible when the fund’s promised liquidity matches the loan portfolio, leverage is restrained, investor disclosure is useful and underwriting remains disciplined.
The objection is not that these advantages are imaginary. It is that they should be demonstrated deal by deal and structure by structure. Growth in assets under management measures demand for a product; it does not establish that every additional loan improves capital allocation.
One danger of a successful industry is that a compelling original idea becomes a distribution target. The discipline that worked at a smaller scale can weaken when capital must be deployed faster than attractive borrowers appear.
A better regulatory question
The policy response should begin with economic functions and contractual promises.
If an investment vehicle finances illiquid loans with long-term capital and transparently allocates losses to investors able to bear them, it does not automatically require the same treatment as a deposit-taking bank.
If it offers convenient withdrawals, adds substantial financing leverage or depends on contingent bank liquidity, those features deserve direct attention. The label on the vehicle cannot settle the issue.
The first priority is a consistent map of exposures. The second is meaningful information about borrower cash flow, restructurings, payment-in-kind interest and valuation changes. The third is stress analysis that considers simultaneous demands on different parts of the financing chain.
There is also a competitive issue. If economically similar promises receive very different treatment merely because they sit in different legal wrappers, activity will tend to move toward the cheaper wrapper. Policymakers need to distinguish beneficial specialisation from the relocation of a risk they intended to constrain.
That distinction is more demanding than either celebrating deregulation or demanding bank rules for every fund. It is also more useful.
What would change my view
I would become more constructive if granular evidence showed that expansion was accompanied by stronger borrower cash coverage, restrained leverage, transparent valuations and stable investor commitments through stress.
I would become more concerned if reported returns remained smooth while cash collections weakened, restructurings accumulated, borrowers repeatedly capitalised interest and liquidity promises became more generous.
Neither list predicts an imminent crisis. It specifies the observations that would help distinguish durable financial intermediation from a postponement of recognition.
For investors and policymakers, six indicators deserve more attention than a single assets-under-management headline: cash interest received, maintenance-adjusted borrower cash flow, the economic terms of restructurings, leverage at each layer, redemption obligations and concentrated exposure to common sponsors or sectors.
The conclusion is less theatrical than a prediction of collapse and more consequential than a celebration of disruption. The financial system can become safer at one institution and more complicated across the network. It can also become better at matching long-term savings to long-term business needs. Both outcomes are possible.
Private credit’s next test is whether the cash flows justify the confidence placed in the structure. Moving the lender was the beginning of the story. Moving, pricing and ultimately absorbing the loss is the part that will decide its economic value.
Sources and data notes
[1] Sebastian Doerr, Gaston Gelos and Vesa Pursiainen, Bank liquidity regulation and the growth of private credit, BIS, 20 October 2026. US county-quarter sample: 2010–2019. Working-paper evidence; the relative estimate is not an aggregate market attribution.
https://www.bis.org/publications/bank-liquidity-regulation-and-growth-private-credit
[2] Basel Committee, Basel III: The Liquidity Coverage Ratio and liquidity risk monitoring tools, January 2013. Historical framework reference.
https://www.bis.org/publications/201301-standards-basel-iii-liquidity-coverage-ratio-and-liquidity-risk-monitoring-tools
[3] Financial Stability Board, Report on Vulnerabilities in Private Credit, 6 May 2026. Market-size estimate refers to end-2024.
https://www.fsb.org/2026/05/report-on-vulnerabilities-in-private-credit/
[4] IMF, Global Financial Stability Report, April 2024, Chapter 2: The Rise and Risks of Private Credit. Historical analytical context.
https://www.imf.org/-/media/files/publications/gfsr/2024/april/english/ch2.pdf
Numerical company and bank examples are Fintech SCB illustrations, not observed transactions. The accompanying chart is a normalised representation of an estimated relative effect, not a time series.
Roberto Balbino — Founder & CEO, Fintech SCB
Independent analysis of finance, economics, geopolitics and global markets
www.fintechscb.com
Originally published on Substack.
Segui Roberto Balbino su Substack