
THE SUNDAY LONG READ Canada’s Prosperity Paradox
Why growth is not reaching households—and what Europe could offer.
By FINTECH SCB | Financial Advisory & Intelligence
Research cut-off: 7 October 2026
Canada possesses many of the assets the global economy increasingly needs: energy, minerals, agricultural capacity, technical expertise, established financial institutions and political stability.
Yet its economic story becomes less comfortable when we move from the size of the national economy to the progress experienced by individual households.
One comparison captures the problem particularly well.
Between 2021 and 2025, Canada’s total real GDP increased by approximately 10.8%, almost exactly matching the cumulative increase in the United States. But real GDP per person rose by only 1.7% in Canada, compared with 7.7% in the US.
Similar growth in the overall economy produced very different results per resident.
That gap helps explain why positive national growth figures can coexist with frustration over housing, wages and living standards. It also explains why the debate about Canada cannot begin and end with American tariffs.
Trade restrictions have made the country’s weaknesses more urgent. Several of those weaknesses were already visible before the latest trade conflict.
To understand Canada’s position, we need to connect subjects that are often discussed separately: immigration and housing; exports and productivity; tariffs and investment; wages and disposable income.
We also need to ask a more precise question about Europe.
A deeper economic relationship with the European Union could offer meaningful opportunities. Formal EU membership would be a radically different proposition, with extraordinary legal obstacles and substantial economic trade-offs.
This Sunday Long Read examines the Canadian economy from its foundations to its strategic choices, comparing its recent performance with the United States and five major European economies.
The central question is whether Canada can turn its considerable national assets into more durable prosperity for the people who live there.
First, what does “Europe” mean in this comparison?
Throughout this article, Europe-5 means the simple arithmetic average of Germany, the United Kingdom, France, Italy and Spain, with each country carrying a 20% weight.
It is not the European Union average. It is not the euro-area average. It is not a population-weighted measure of European living standards.
The distinction matters immediately: the UK is outside the EU and retains its own currency and monetary policy. The other four countries belong to the euro area.
An equal-country average answers a specific question: how does Canada compare with the average national outcome across this selected group?
It does not answer how Canada compares with the combined European economy or the average European resident.
Those questions require different weights. Unemployment should be aggregated using labour-force weights; migration intensity requires an appropriate population denominator; GDP volumes require consistent aggregation; average wages depend on the relevant employee population.
Using one weighting system indiscriminately would create misleading precision.
The charts therefore show Canada, the US and Europe-5, while retaining individual-country detail. In the trend charts, the shaded European band represents the minimum and maximum observations among the five countries. It is a range of national outcomes, not a statistical confidence interval.
This is especially important for unemployment. Germany and Spain have very different labour-market outcomes, even when both are included in the same European benchmark.
For GDP, unemployment, disposable income and wages, the main comparison covers 2021–2025. For permanent-type immigration, the latest common five-year panel verified for this analysis covers 2020–2024.
Selected Canadian developments in 2026 are discussed separately. Monthly releases, annual observations, policy targets and forecasts are not interchangeable.
All nine charts appear together at the end of the article.
1. What the Canadian economy actually runs on
Canada is best understood as a service economy with an important resource and manufacturing export base.
Its export basket should not be mistaken for the composition of its entire economy.
Oil, gas, metals and agricultural products are highly visible because they cross borders and respond to global prices. But much of Canada’s domestic economic activity comes from finance, professional services, retail, transport, healthcare, education, public administration and housing-related services.
The OECD’s structural profile places services at roughly 71% of value added in its 2021 observation. That is a dated structural reference, rather than a claim about the precise sectoral share in 2025.
Four broad pillars help explain the model.
The first is the service economy.
Toronto concentrates financial and professional activity. Montréal combines services, aerospace and research. Vancouver connects Pacific trade, services and digital activity.
Software, engineering, consulting and financial expertise can generate international revenue without the same transport requirements as an automobile or a tonne of minerals.
This creates an important diversification opportunity. Canada can expand the foreign customer base for expertise already developed at home, alongside its physical exports.
The second pillar is natural resources.
Canada’s resource base includes oil and gas, uranium, potash, metals, forests, agricultural land and substantial hydroelectric capacity.
These assets generate exports, investment and public revenue. But geological abundance does not automatically translate into commercially competitive production.
A deposit far from transport infrastructure, reliable electricity and processing facilities can be much less valuable economically than its physical size suggests.
Canada’s substantial non-emitting electricity generation is another potential advantage, particularly for energy-intensive industries. However, national generation statistics do not guarantee that sufficient power is available at the right location, price and time for a specific project.
The third pillar is manufacturing integrated with North America.
Vehicles and components, aerospace, machinery, food processing and metal products link Canadian production closely to the US economy.
The relationship involves suppliers, intermediate inputs, engineering, logistics and production schedules—not simply the final destination of a finished product.
An automotive component may participate in a production process organised around factories on both sides of the border. Finding a European buyer for a finished vehicle does not automatically replace that production network.
The fourth pillar is the residential economy.
Construction, property services, mortgage finance and housing-related consumption are deeply connected to household balance sheets.
An important accounting distinction is often lost here: real-estate value added includes housing services, including services imputed to owner-occupiers. It is not merely estate-agent commissions.
Similarly, an increase in the price of an existing home is not, by itself, an increase in current production.
That distinction separates rising property wealth from an expansion in the economy’s productive capacity.
Canada is also economically diverse within its own borders.
Ontario and Québec have significant manufacturing exposure. Alberta and Saskatchewan are more sensitive to energy and resources. British Columbia combines housing, services, forestry and Pacific connections. Atlantic provinces have their own combinations of services, fisheries, energy and demographic pressures.
A higher oil price can support some exporters and provincial revenues while raising transport and household costs elsewhere.
There is no single, uniform “Canadian effect”.
2. How the model evolved—and where the strain emerged
Canada’s long economic trajectory combines resource development, increasingly sophisticated services and close integration with the United States.
Access to a very large neighbouring market allowed Canadian businesses to specialise and reach a scale that domestic demand alone would not always support.
That integration created efficiency. It also concentrated risk.
The pandemic interrupted production, mobility and supply chains. Reopening then produced large growth rates that must be interpreted against the preceding losses.
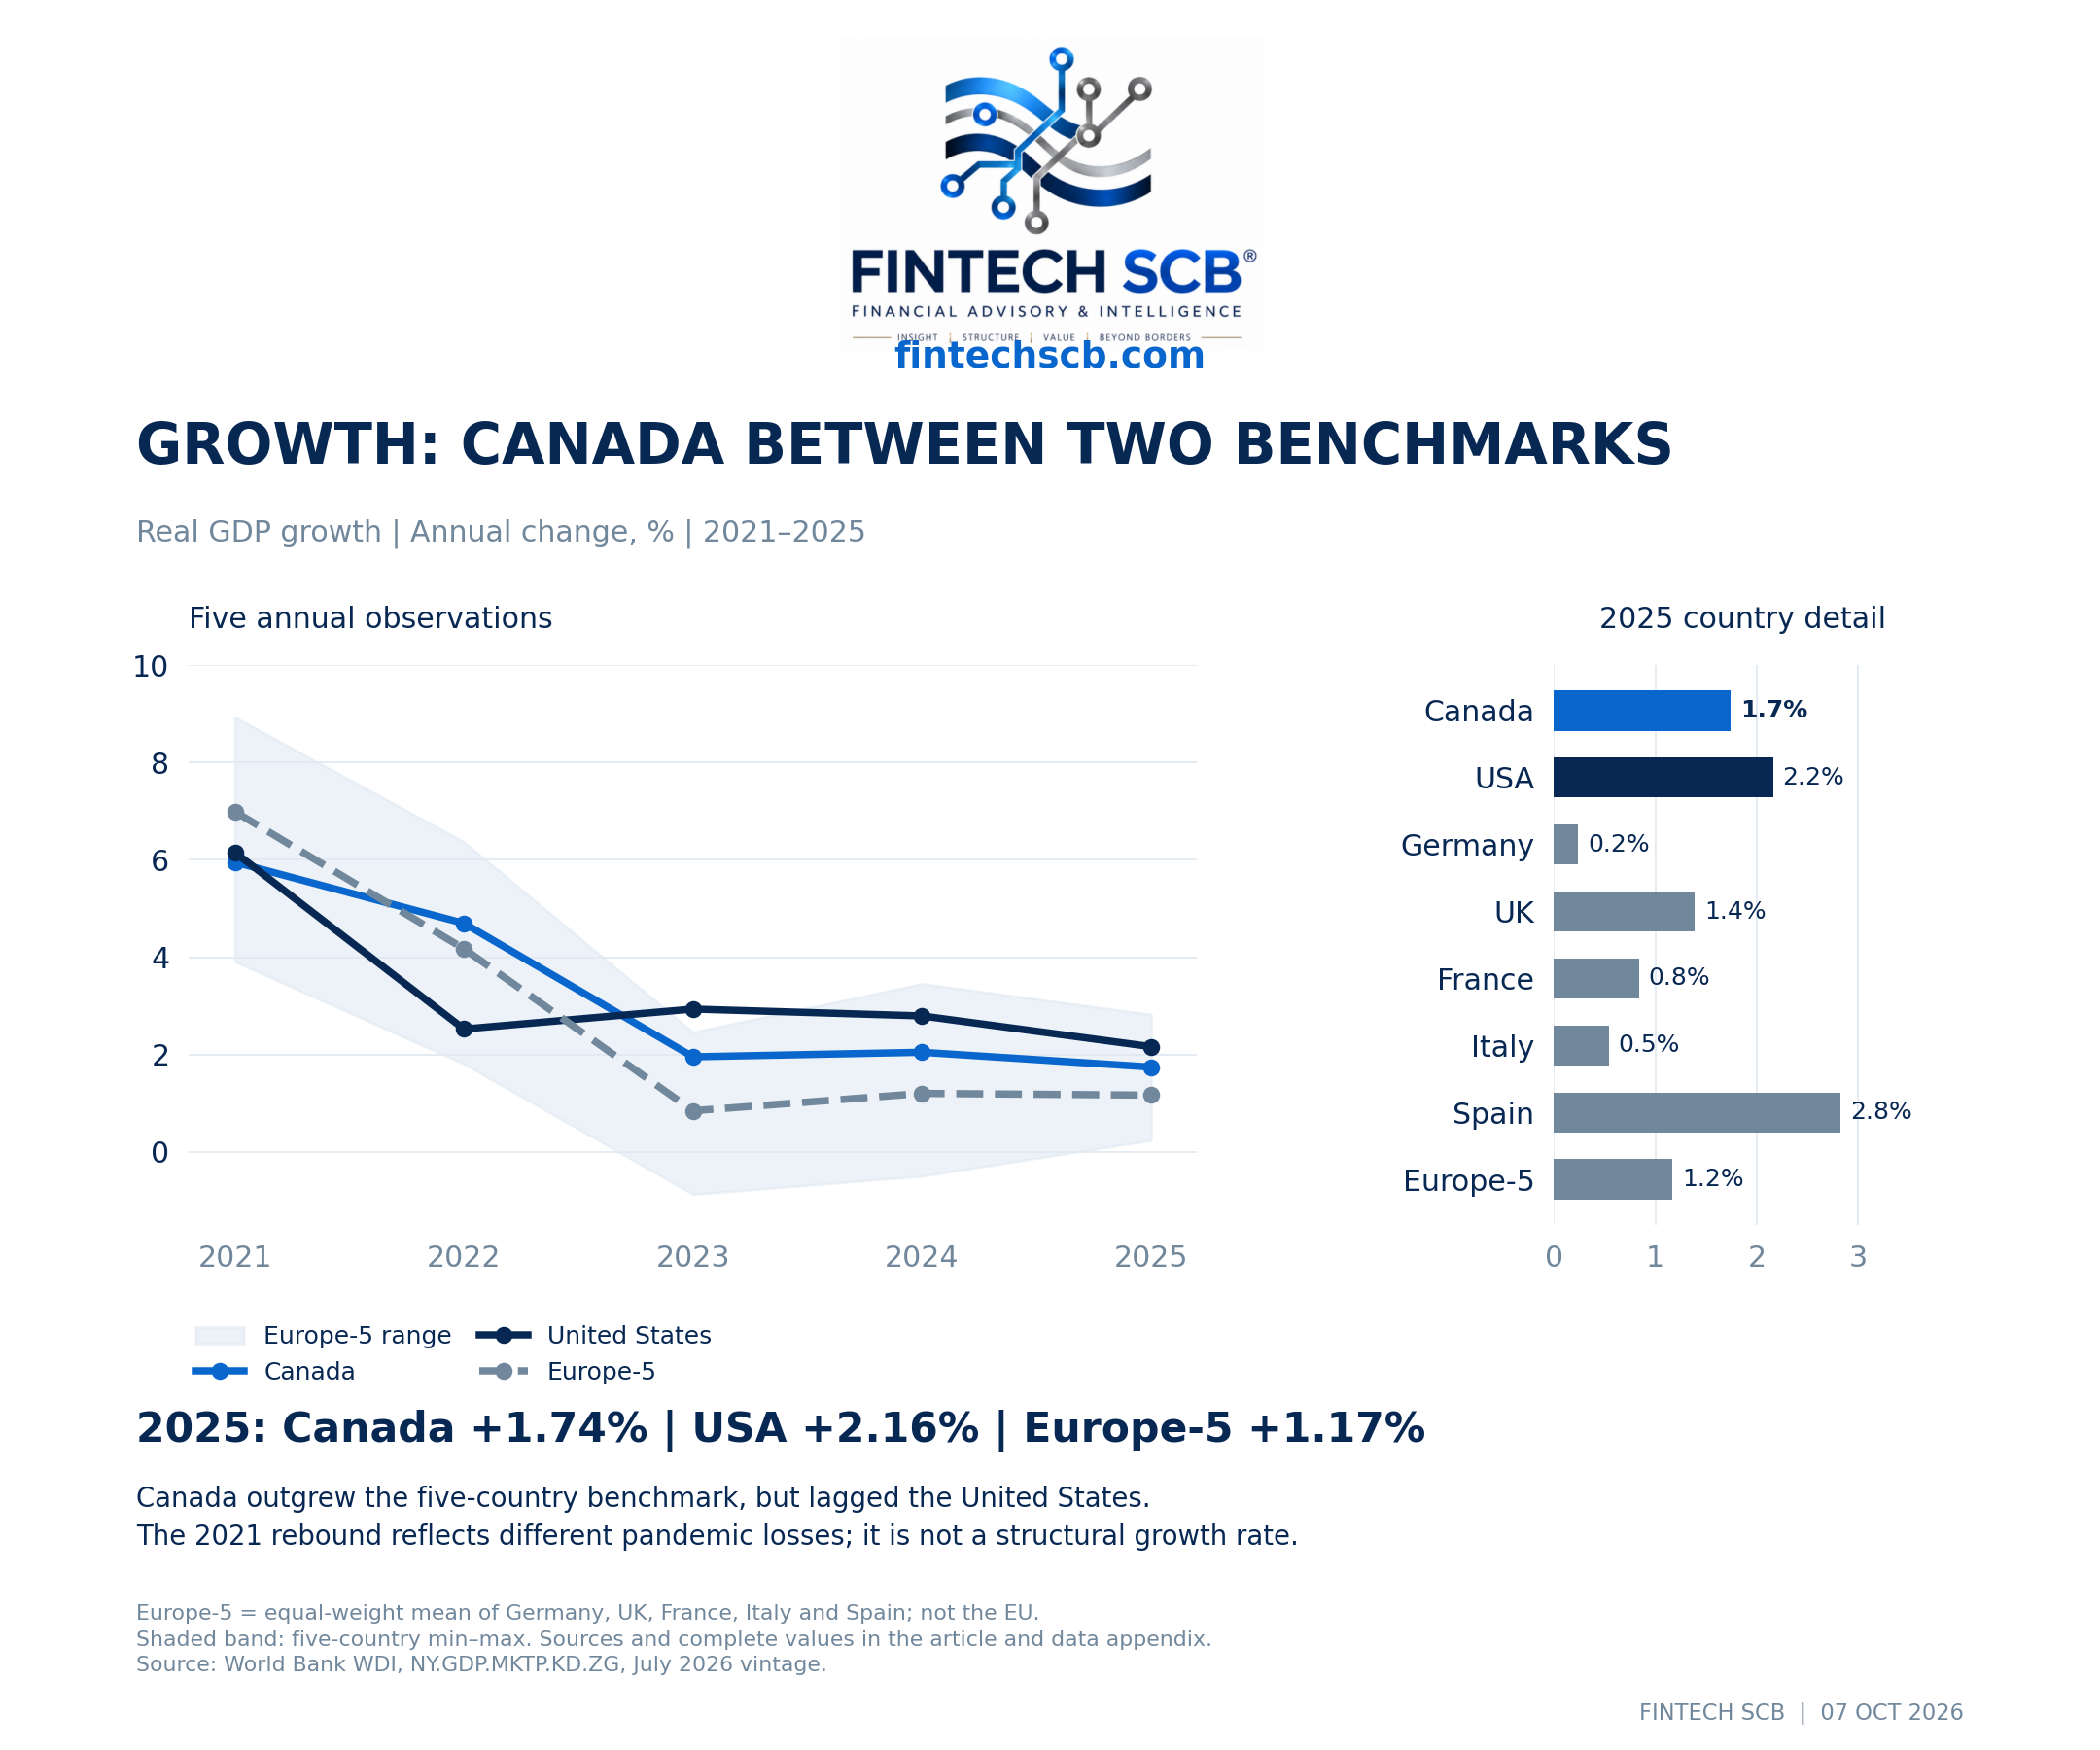
In 2021, real GDP expanded by approximately 5.95% in Canada, 6.15% in the US and 6.99% in Europe-5.
Those figures are not clean measures of structural dynamism. A stronger rebound can partly reflect a deeper earlier contraction.
Between 2022 and 2024, several forces overlapped: inflation, higher financing costs, the withdrawal of pandemic support and rapid population growth.
Canada continued to expand in aggregate. But its real GDP per person fell in both 2023 and 2024.
This chronology is essential.
The weakness in individual economic progress was already visible before the new tariffs introduced in 2025.
Trade restrictions subsequently added an external-market problem to existing domestic constraints involving investment, productivity and housing.
Uncertainty can affect activity before any tariff is actually paid. If a company does not know the conditions under which it will sell into its main market three years from now, it may postpone an investment today.
Canada therefore faces two tasks simultaneously: absorbing the trade shock and improving the productive capacity of its economy.
Temporary support can help with the first task. It cannot substitute for the second.
3. GDP growth: a larger economy does not guarantee greater prosperity per person
Chart 1 places Canada between the American and European benchmarks.
In 2025, real GDP growth was approximately:
Canada: 1.74%
United States: 2.16%
Europe-5: 1.17%
Canada outperformed the selected European average but lagged the United States.
That is a more balanced description than either economic collapse or unqualified success.
The interpretation changes when population is included.
Real GDP per capita measures output divided by the number of residents. If population grows almost as quickly as production, output per resident increases only modestly.
The relationship is multiplicative: per-capita growth depends on the ratio between GDP growth and population growth, rather than a simple subtraction of percentage rates.
Chart 2 shows the consequence.
Between the levels recorded in 2021 and 2025, Canada’s total real GDP increased by about 10.8%. The US increase was also about 10.8%.
Over the same period, real GDP per person increased by approximately:
Canada: 1.7%
United States: 7.7%
Europe-5: 5.7%
These are cumulative changes across four annual intervals between five annual observations.
The comparison does not establish that immigration necessarily reduces prosperity. It shows why population growth must be accompanied by investment, infrastructure, housing and effective labour-market integration.
Additional residents increase the population denominator immediately. Their contribution to entrepreneurship, productivity and tax revenue develops through employment, skills utilisation and investment.
The outcome depends on how effectively the economy combines people with productive capacity.
GDP per person also has limits. It is a measure of output, not the amount of money received by the average household. It includes profits, depreciation and public production, and says little about distribution.
To understand living standards, we must also examine disposable income, real wages and housing costs.
Sources: World Bank World Development Indicators, real GDP growth and real GDP per-capita growth; calculations using the July 2026 data vintage.
4. Unemployment: the deterioration began before the tariffs
Canada’s unemployment rate fell to approximately 5.28% in 2022 after the reopening recovery.
It then increased to:
5.42% in 2023
6.35% in 2024
6.91% in 2025
The increase from 2022 to 2025 was 1.63 percentage points.
In 2025, the comparable US rate was approximately 4.20%, leaving Canada 2.71 percentage points higher. Europe-5 averaged approximately 6.55%.
Chart 3 shows Canada moving from below the European benchmark to above it.
Again, the sequence matters. A substantial part of the deterioration was already present in 2024.
Labour demand depends on financing costs, domestic spending, investment decisions and sectoral conditions. Labour supply depends on population, migration and participation.
The aggregate unemployment series cannot assign a precise causal contribution to each factor.
European differences are substantial. In 2025, the comparable rates were approximately 3.71% in Germany, 4.75% in the UK, 6.39% in Italy, 7.54% in France and 10.38% in Spain.
Canada therefore had a higher rate than Germany, the UK and Italy, but a lower rate than France and Spain.
Describing its performance simply as “better than Europe” or “worse than Europe” would conceal these differences.
The latest Canadian monthly release verified for this article covers August 2026. Statistics Canada reported unemployment at 6.4%, unchanged over the month, alongside an employment decline of 42,000.
A stable unemployment rate can coexist with falling employment when labour-force participation changes.
For that reason, the monthly national release is discussed separately from the annual ILO-modelled comparison in the chart.
Sources: World Bank/ILO annual unemployment series; Statistics Canada, Labour Force Survey, August 2026.
5. Household income: what remains after inflation, taxes and transfers?
“Average income” can mean several different things.
A salary is not the same as household income. Gross pay is not the same as money available after taxes. A national average is not the same as the experience of the household in the middle of the distribution.
Chart 4 uses real household disposable income per person.
This measure incorporates income from employment, self-employment and property, together with cash transfers, after taxes and social contributions. The OECD series covers households and non-profit institutions serving households.
The word “gross” in the underlying national-accounts definition means before depreciation. It does not mean before income taxes.
Between 2021 and 2025, Canada’s real disposable household income per person was essentially unchanged: approximately −0.04%, which can reasonably be described as flat.
Over the same period, it increased by approximately 0.9% in the US and 3.0% in Europe-5.
Within the European group, the cumulative changes were approximately:
Spain: +6.0%
France: +3.5%
Germany: +2.9%
Italy: +2.6%
United Kingdom: +0.1%
The Canadian path was not a continuous decline. Real disposable income per person fell in 2022 and 2023, then recovered in 2024 and 2025.
In 2025 alone, the increase was approximately 1.06% in Canada, 1.17% in the US and 0.78% in Europe-5.
The latest annual recovery and the cumulative outcome therefore tell different stories. Improvement in the most recent year did not produce a large gain relative to the starting point.
That starting point also matters.
The year 2021 still reflected pandemic-era support. Choosing an earlier base would change the result, particularly for Canada and the US.
These indexed comparisons measure growth from a selected starting point. They do not rank countries by their absolute income levels.
The household-income comparison uses the OECD’s May 2026 data snapshot. Subsequent releases can revise historical observations.
There are further limits. The measure is an average, not a median. It does not adjust for household size and composition. It also excludes social transfers in kind, such as certain publicly provided healthcare and education services.
A full comparison of living standards would therefore benefit from adjusted disposable income, purchasing-power comparisons and distributional measures.
The chart answers a narrower but important question: how did average real disposable resources per resident evolve within each economy?
6. Real wages: higher nominal pay can still leave workers standing still
Chart 5 examines a different measure: the OECD’s average annual gross wage per full-time-equivalent employee, expressed in constant prices.
Each country is indexed to 100 in 2021 before the European average is calculated. This avoids the meaningless exercise of averaging euros, sterling and dollars at current exchange rates.
By 2025, real average wages were approximately:
0.8% below their 2021 level in Canada
0.3% above their 2021 level in the US
0.3% below their 2021 level in Europe-5
The latest annual changes were more favourable: approximately +0.20% in Canada, +1.67% in the US and +1.21% across the European benchmark in 2025.
Canada was recovering, but the recovery had not fully restored real average pay relative to the selected base.
European outcomes again differed. Germany was approximately 2.2% above its 2021 level, while Italy was 3.1% below. France and the UK remained slightly below, and Spain slightly above.
These are average employee wages, not median earnings or total household disposable income.
Employment composition also matters. If lower-paid workers lose their jobs disproportionately, the average wage of those still employed can rise without any individual receiving a pay increase. Rehiring can later reverse that statistical effect.
The pandemic makes this qualification particularly relevant.
The broader message is that nominal pay growth is insufficient evidence of improved purchasing power. Inflation, taxes, transfers, household composition and housing costs determine how much of that increase translates into a better standard of living.
Sources for Charts 4–5: OECD household indicators and average annual wages. Household-income observations use the May 2026 snapshot; wage calculations use constant-price national-currency observations.
7. Immigration: economic potential depends on the capacity to absorb it
Immigration is central to Canada’s economic model.
It can expand the workforce, support entrepreneurship, offset part of the pressure from population ageing and fill occupational shortages.
But the comparison must begin with a clear definition.
Chart 6 measures standardised permanent-type immigration admissions, rather than all arrivals or net migration.
In 2024, the OECD comparison records approximately 483,600 admissions for Canada and 1.425 million for the United States.
The US received more people in absolute terms. Canada’s inflow was much larger relative to its population.
Admissions per 1,000 residents were approximately:
Canada: 11.7
United States: 4.2
Europe-5: 5.6
Canada’s intensity was therefore around 2.8 times the American rate.
However, permanent admissions are not necessarily people newly arriving at an airport. Some are individuals already present who change legal status.
The OECD series also includes relevant free-movement flows in Europe. It excludes temporary workers and students, asylum applicants and Ukrainian temporary protection. US observations follow the fiscal year.
These are meaningful limitations, not technical footnotes that can be ignored.
Net migration is a different concept: it accounts for departures as well as arrivals within its defined statistical framework.
The economic benefits of immigration depend on what happens after admission.
New residents need housing, transport, healthcare and education. Employers need equipment, premises, software and organisational capacity if a larger workforce is to become more productive.
When investment and infrastructure fail to keep pace, congestion and competition for existing capacity increase.
Blaming immigration for the entire housing problem would ignore supply restrictions and investment failures. Ignoring the additional demand would be equally incomplete.
Skills utilisation is another critical variable. A qualified professional consistently employed below their skill level represents productive potential that the economy is failing to use.
Credential recognition, provincial mobility and links between admissions and labour-market needs influence the return on immigration.
Canada’s policy is now changing. The 2026–2028 plan sets permanent-resident admissions targets at 380,000 per year while reducing targets for new temporary residents.
These are policy objectives, not completed outcomes.
Population estimates released in September 2026 put non-permanent residents at approximately 2.780 million on 1 July, or 6.7% of the population, down by around 154,600 over the preceding year. Annual population growth slowed to approximately 0.5%.
Slower population growth has mixed effects. It can ease some immediate housing pressure while also reducing aggregate consumption growth and creating shortages in particular occupations.
Its long-term value depends on whether the country uses the adjustment period to expand housing and productive capacity.
Sources: OECD International Migration Outlook 2025; World Bank population data; Immigration, Refugees and Citizenship Canada; Statistics Canada population estimates.
8. What Canada exports—and why the composition matters
Canada’s exports extend well beyond oil.
In 2025, exports of goods and services reached approximately C$1,016.3 billion, comprising C$775.8 billion in goods and C$240.5 billion in services.
Services represented around 23.7% of the total.
Chart 7 highlights selected categories:
Energy: C$162.2 billion
Commercial services: C$143.9 billion
Metal and non-metallic mineral products: C$119.4 billion
Vehicles and parts: C$91.6 billion
Consumer goods: C$90.3 billion
Travel services: C$72.0 billion
These are current Canadian-dollar values on a balance-of-payments basis. They are gross export receipts, not net contributions to Canadian GDP.
Commercial services include activities such as professional, financial and digital services. Travel exports include spending by non-resident visitors and students.
A university can therefore generate service exports without shipping a physical product abroad.
Export composition influences the interpretation of growth. Commodity prices can raise receipts without a matching increase in production. A stronger gold price, for example, has a different economic meaning from an increase in the number of firms selling specialised machinery abroad.
Market diversification also requires different kinds of investment.
A software company may need overseas sales capacity, contracts and regulatory expertise. A resource producer may need transport and processing infrastructure. An automotive supplier may face customer certification and production-network constraints.
Trade agreements can improve access. They do not eliminate these commercial requirements.
Source: Global Affairs Canada, State of Trade 2026.
9. Tariffs: what changed, who bears the cost and what the data show
A US tariff is paid to US customs by the importer.
Its economic cost, however, can be distributed across American customers, importers and Canadian exporters through higher prices, reduced margins and lower sales.
Both simplistic claims—“Canada pays every tariff” and “Canada is unaffected because the importer pays”—miss this distinction.
Consider a Canadian component sold to an American manufacturer.
Once a tariff raises its landed cost, the customer may absorb the increase, ask the supplier for a discount, raise its own selling price or switch suppliers.
The Canadian producer may lose margins, orders or future investment. It may also decide to produce inside the United States.
Such a decision could preserve the company’s access to customers while reducing production and employment in Canada.
The tariff chronology has involved repeated changes rather than one permanent, uniform rate.
In 2025, general and sector-specific measures were introduced alongside exemptions and changes in CUSMA/USMCA treatment. Canada subsequently removed many broad countermeasures introduced in March while retaining measures in selected sectors.
The situation changed again in 2026.
According to Finance Canada’s 25 August announcement, the US imposed an additional 50% tariff on a specified C$27.6 billion set of Canadian goods effective 22 August. Canada’s response, effective 8 September, included selected counter-tariffs of 15%, 25% and 50%.
Those rates should not be described as applying uniformly to all Canadian exports. Product classification, origin, sector-specific rules and overlapping measures determine the actual treatment.
The Trade Commissioner Service also records further changes in September. A headline from the beginning of the dispute is therefore an unreliable description of the rules applicable to a shipment months later.
Chart 8 separates observable trade outcomes from claims about causation.
In 2025, Canadian goods and services exports increased by approximately 0.7% in nominal terms but declined by 1.4% in volume. Exports to the US fell by 3.7%, while exports elsewhere increased by 11.1%.
The US share declined from 70.3% to 67.2%.
That represents a change in trade patterns. It does not, by itself, measure the isolated effect of tariffs.
Energy prices, gold exports, changes in demand and the timing of shipments all affected the results. Businesses can also bring orders forward before restrictions take effect, creating a strong period followed by a weaker one.
The 2026 escalation is a separate development and is not included in those 2025 outcomes.
To estimate the tariff damage rigorously, we would need a counterfactual: what would output, investment and exports have been without the restrictions?
That requires assumptions about effective tariff rates, demand elasticities, exchange rates, imported inputs, retaliation and business responses.
This article does not invent a percentage loss of GDP from a simple before-and-after comparison.
The policy response also involves trade-offs.
Temporary liquidity support can help viable businesses survive disruption. Training and transition programmes can help workers move to new opportunities.
But indefinite protection can preserve activities that no longer have a sustainable economic basis. Counter-tariffs may strengthen negotiating leverage while also raising costs for Canadian importers and downstream businesses.
Monetary policy can support demand. It cannot remove a foreign tariff or rebuild an integrated supply chain.
Sources: Finance Canada; Trade Commissioner Service; Global Affairs Canada, State of Trade 2026; Bank of Canada.
10. Could Europe become Canada’s economic alternative?
Europe can become a more important partner. It cannot simply replace North American geography.
The first point is that Canada already has a substantial trade agreement with the EU.
The Comprehensive Economic and Trade Agreement—CETA—has been provisionally applied since 2017. It provides for the removal of tariffs on approximately 99% of tariff lines, with around 98% liberalised at the outset.
Preferential access still depends on rules of origin and other applicable requirements. Provisional application of the commercial provisions should also be distinguished from full ratification of the entire agreement.
This existing framework changes the analysis.
The incremental benefit of a closer relationship cannot be calculated as though Canadian products currently face a general tariff wall in Europe.
Many of the remaining opportunities concern services, standards, professional recognition, procurement, investment, research and the practical costs of entering a new market.
A more productive European strategy would focus on those remaining barriers.
For a professional-services business, recognition of qualifications and predictable rules can matter more than a tariff reduction. For an industrial exporter, certification and public procurement access may be decisive. For a research-intensive company, participation in collaborative programmes can improve access to expertise and partners.
These are concrete opportunities that can be evaluated individually.
They should not all be attributed to the much more speculative idea of EU membership.
11. What would Canada gain—and give up—from hypothetical EU membership?
Formal accession is an extraordinary hypothetical scenario.
Article 49 of the Treaty on European Union provides an accession route for a European state that respects the Union’s values.
Canada is not ordinarily considered a European state for that purpose.
A membership solution would therefore require an exceptional political and legal settlement, likely involving treaty changes and the necessary ratifications. It would not be an ordinary enlargement application or a decision that the European Commission could take alone.
Economically, the potential gains from very deep integration would include a larger market, reduced regulatory friction in some activities, stronger research and investment links, and less dependence on a single export destination.
Participation in EU institutions would also provide a voice in common decision-making.
But membership comes with obligations as well as access.
On goods trade, deeper CETA cooperation would build on preferences already in place. Membership would involve participation in the customs union under negotiated accession terms.
On services and professional activity, targeted agreements can improve access and recognition. Membership could provide broader single-market rights, accompanied by broader regulatory obligations.
On the American relationship, incremental cooperation with Europe allows greater continuity in Canadian trade policy. EU membership would raise fundamental questions about compatibility with CUSMA.
The EU has exclusive competence over its customs union and common commercial policy. Canada could not assume that its existing independent external trade arrangements would remain unchanged.
On regulation, sectoral cooperation allows Canada to negotiate commitments in selected areas. Membership would require much wider application of EU law, creating substantial federal and provincial implementation challenges.
On public finances, participation in individual programmes involves specified contributions. Membership would bring wider budget obligations. Any net fiscal position would depend on negotiated conditions; EU funding should not be treated as a guaranteed free transfer.
On institutional influence, membership would provide formal participation in EU decision-making. Cooperation through agreements offers influence of a different kind, without the same institutional rights.
On the currency, EU accession and euro adoption are separate questions.
Accession would not automatically mean adopting the euro immediately. But neither should an analysis assume that Canada would obtain a permanent exemption.
Eventual participation in the single currency could remove exchange-rate costs with the euro area while also removing Canada’s independent monetary policy and exchange rate.
For an economy strongly influenced by commodity prices and US demand, that would be a significant trade-off.
Distance would remain a cost in every scenario.
European demand can support Canadian energy, minerals, services and specialised manufacturing. It cannot reproduce the proximity between Canadian factories and American production networks.
EU membership would not automatically protect Canadian products from tariffs imposed by a third country, either.
The most credible near-term route is therefore deeper practical integration.
Canada’s association with Horizon Europe and the June 2026 conclusion of the agreement concerning Canadian participation in SAFE procurement show that meaningful sectoral integration can advance without membership.
These frameworks create opportunities, not guaranteed contracts or revenue.
My assessment is that Canada would benefit from a more ambitious European economic strategy. The strongest case rests on better use of CETA, targeted integration and domestic investment.
There is no verified basis here for promising a particular percentage increase in Canadian GDP from joining the EU.
12. Canada’s strengths and weaknesses are closely connected
Several Canadian advantages also create vulnerabilities.
Resources provide revenue and strategic relevance, but expose the economy to global price cycles. Logistics, project economics and environmental conditions determine how much of that resource base can be developed competitively.
Human capital supports innovation and services, but qualifications can be underused. High housing costs can also make it harder for skilled workers to locate where they are most productive.
The financial system supports households and businesses, while major institutional investors provide a substantial pool of expertise and capital. Household leverage and property exposure nevertheless create vulnerabilities that require attention.
Access to the United States provides commercial scale, but concentrates exposure to American demand and policy decisions. Agreements such as CETA broaden the opportunity set without eliminating that dependence.
Non-emitting electricity can attract investment, particularly in activities where energy costs and emissions matter. Local network capacity and interconnection determine whether the national advantage is available to a specific project.
Stable institutions support confidence, while regulatory fragmentation and implementation delays can reduce the return on that institutional strength.
Geography provides Atlantic and Pacific access and extensive resources, but also creates long distances, infrastructure costs and exposure to physical climate risks.
The relevant question is how well these strengths are converted into productive investment.
A natural-resource deposit, a pension fund and a skilled migrant are all valuable assets. Their economic contribution depends on the projects, institutions and infrastructure that connect them.
Canada’s productivity challenge is therefore also a coordination challenge.
13. Housing: where national success can become household frustration
Housing connects almost every part of the Canadian debate.
Workers choose where to live partly on the basis of wages, rent and commuting costs. Employers’ ability to recruit depends partly on whether employees can afford to live within reach of the workplace.
When housing supply does not expand adequately in productive locations, higher earnings can be absorbed by higher accommodation costs.
The consequence is not only social pressure. It can also weaken labour mobility and productivity.
Existing homes and new construction must be distinguished.
A transaction involving an existing home transfers an asset. A newly completed home expands the usable housing stock.
Higher land values can encourage some development while making other projects less viable, particularly when combined with financing costs, construction expenses and lengthy approvals.
“Build more” is therefore incomplete unless it specifies where, with what infrastructure and under which practical constraints.
Different households experience the same market very differently.
An owner without a mortgage may benefit from rising property values while facing relatively stable cash costs. A mortgaged owner must consider financing conditions. A new buyer or renter faces current market prices.
An average real-income index does not isolate those differences.
Nor does the general inflation rate equal the cost of signing a new lease in Toronto or Vancouver.
Policies also distribute gains and losses differently.
Supporting purchasing power without expanding supply can push prices higher. Expanding supply takes time and coordination. A price correction can help some new buyers while weakening existing owners’ balance sheets and discouraging development.
The policy objective should be sustained affordability and adequate supply, rather than maximising or minimising a property-price index in isolation.
This is why the income, immigration and GDP-per-person charts belong in the same economic story.
14. Productivity: the missing link between national assets and pay
GDP per person can be decomposed into output per hour, hours worked per employed person, and employment relative to the population.
Productivity is the first component. Demography, participation, unemployment and working-time choices influence the others.
An improvement achieved through longer hours is not identical to one achieved through better equipment, software or organisation.
For Canada, a central question is how much productive capital accompanies each additional worker.
A technician with improved equipment may produce more. Several technicians sharing the same constrained equipment may have lower output per person.
Capital includes machinery and infrastructure, but also software, research, organisational processes and management capability.
The quality of investment matters as much as the amount announced.
Resource development illustrates the point. Extraction, processing, technology design and project finance generate different kinds of activity.
Keeping every stage of a supply chain in Canada is not automatically efficient. Some activities require scale, skills or input costs that may be more favourable elsewhere.
The objective should be durable competitiveness and domestic value creation, rather than local processing at any cost.
Competition also matters.
Businesses sheltered from competitive pressure may have weaker incentives to invest. Efficient smaller companies may struggle to reach scale if expansion across provinces creates repeated regulatory burdens.
The OECD’s Canadian productivity analysis highlights business investment and dynamism as areas requiring improvement.
This does not mean households should simply wait for future gains. Training, mobility assistance and transitional support can distribute adjustment costs more fairly.
But sustained income growth ultimately needs a productive base or a sustainable source of transfers. Borrowing cannot permanently replace resources that the economy is not generating.
15. Fiscal policy, interest rates and the exchange rate have different jobs
Fiscal policy can stabilise incomes and investment when private demand weakens.
It can also address coordination problems. Public infrastructure may make private projects commercially viable where individual firms would otherwise be unable to justify the initial cost.
However, spending labelled “investment” is not automatically productive.
Projects should be assessed over their full life cycle, including maintenance, delays and actual utilisation.
International debt comparisons require equal care.
Canadian federal debt should not be compared directly with another country’s general-government debt. Gross and net measures are not interchangeable.
Public financial assets improve the net position, but some are associated with pension obligations and cannot be treated as freely available spending money.
The IMF has recognised Canada’s relatively favourable net-debt position within the G7 while also emphasising fiscal discipline and productive investment. That is an advantage, not unlimited fiscal capacity.
Monetary policy faces a different problem.
A trade shock can weaken employment and spending, supporting the case for easier financial conditions. At the same time, tariffs and disrupted supply chains can increase some prices.
The central bank must distinguish temporary price effects from persistent inflation and changes in expectations.
The exchange rate can absorb part of the shock. A weaker Canadian dollar can make Canadian products cheaper in foreign currency at a given domestic price.
But it also raises the domestic cost of imported machinery, components and consumer goods.
An exporter with substantial imported inputs may therefore gain less than the headline currency movement suggests.
A weaker currency does not remove rules of origin, regulatory uncertainty or a customer’s decision to relocate production.
The appropriate policy mix depends on the problem.
A temporary shortage of orders may justify liquidity support. A permanent change in market access may require new products or customers. A housing supply constraint requires additional capacity, even if lower interest rates provide short-term relief.
16. The European comparison produces no single winner
Chart 9 brings together several indicators and shows why a national comparison needs more than one metric.
Germany combines low unemployment with weak recent growth. Between 2021 and 2025, its real GDP per person increased by only about 0.3%.
Spain recorded the strongest 2025 GDP growth among the seven countries in this comparison, but also had the highest unemployment rate.
Italy’s unemployment rate was below Canada’s in 2025, while its real average wages remained further below their 2021 level.
France and the UK add other combinations of growth, employment and purchasing power.
These outcomes are not contradictory. They measure different dimensions of an economy.
A country can have low unemployment and weak productivity growth. It can have strong aggregate growth and expensive housing. It can improve disposable income through transfers even while employee wages remain under pressure.
Comparisons of living standards also need to consider healthcare, education, taxation and public services.
A higher gross salary does not translate directly into an equivalent advantage in disposable household welfare. Housing costs vary greatly within countries as well as between them.
Europe-5 is therefore a useful diagnostic benchmark, not a universal ranking of economic models.
17. What would improve Canada’s long-term prospects?
Five priorities follow from the analysis.
First, increase productive capacity per person.
Machinery, software, electricity networks, transport infrastructure and complementary skills need to grow alongside the workforce.
The measure of success is completed and utilised capacity—not the monetary value of announcements.
Second, make the domestic market work more like a single market.
More compatible standards, better recognition of professional qualifications and fewer interprovincial frictions can improve scale and competition.
Changing a federal rule does not automatically remove provincial barriers. Implementation and coordination matter.
Third, connect housing and demographic policy.
Housing needs to be built where jobs and services make it useful. Infrastructure and approval processes influence whether supply can respond.
Demand subsidies without additional supply can be capitalised into higher prices. Lower migration without supply reform can reduce one pressure while leaving the underlying constraint intact.
Fourth, diversify by product and customer, not only by destination.
Higher exports to an international gold-trading centre do not mean the same thing as a durable new customer base for engineering, software or industrial components.
Success should be assessed through volumes, recurring exporters, domestic value added and associated investment—not nominal receipts alone.
Fifth, keep temporary protection from becoming permanent dependence.
Support can help firms and workers adapt. It should have measurable objectives, a defined duration and credible exit conditions.
Resilience does not require producing everything domestically. It requires reducing dangerous dependencies without surrendering every benefit of specialisation.
Europe can support several of these priorities through demand, research links, investment and cooperation.
Domestic implementation will determine how much of that opportunity becomes real.
18. Three scenarios worth monitoring
The following scenarios organise the choices. They are not forecasts with assigned probabilities.
Scenario one: productive renewal.
Canada increases capital per worker, completes important infrastructure and establishes more stable access to export markets.
The signs would include stronger productivity, sustained growth in real GDP per person, higher private investment and durable expansion in export volumes outside the US.
In this scenario, diversification would be supported by additional productive capacity rather than a temporary shift in commodity prices.
Scenario two: slow adaptation.
Businesses absorb part of the trade shock, but investment and housing remain constrained.
Total GDP continues to grow while real-income progress remains modest. Unemployment stays relatively elevated, and the improvement experienced by households falls short of the headline national expansion.
This would extend the gap between a larger economy and stronger individual prosperity.
Scenario three: deeper fragmentation.
Additional trade restrictions encourage businesses to relocate productive capacity or cancel Canadian projects.
Warning signs would include weaker orders, lower capacity utilisation, cancelled investment and localised credit stress.
The damage could persist beyond the immediate loss of export sales if it reduced the future capital stock and the development of domestic skills.
Forecasts must also retain their publication dates.
The Bank of Canada’s July 2026 projection put real GDP growth at 0.7% for 2026 and 1.8% for both 2027 and 2028.
That forecast preceded the August tariff escalation. It should not be presented as though it automatically incorporated every later development.
The most useful test of Canada’s progress will be whether it can improve output per hour, investment per worker and housing accessibility together.
A lower unemployment rate caused mainly by reduced participation is not equivalent to stronger job creation. A higher GDP-per-person figure driven only by slower population growth is not equivalent to a broad productivity revival.
The quality of the improvement matters.
The Canadian opportunity
Canada’s advantages remain substantial.
It has resources that international markets need, the capacity to attract people and capital, established institutions and connections to both Atlantic and Pacific markets.
Its weakness is the uneven conversion of those advantages into greater prosperity per resident.
American tariffs have exposed the cost of concentrated trade dependence. They have not created every underlying problem.
The decline in GDP per person during 2023 and 2024, the earlier rise in unemployment, weak cumulative real-wage progress and housing pressures all point to issues that require a domestic response.
A closer relationship with Europe can help by widening commercial opportunities, supporting research and investment, and reducing reliance on a single customer.
But the practical case for deeper integration is much stronger than the suggestion that EU membership would solve Canada’s difficulties.
Canada already has significant preferential access through CETA. The next gains will depend on using that access effectively, addressing remaining barriers and building the capacity needed to serve additional markets.
The country’s task is to connect its resources, financial capital and human talent with the infrastructure and business conditions that make them productive.
That is the standard against which its next economic chapter should be judged.
A more prosperous Canada will be measured not only by how much larger its economy becomes, but by how consistently that growth improves the lives of the people within it.
Data and source notes
The GDP and unemployment comparisons use World Bank WDI data, with unemployment drawn from the ILO-modelled series. Historical values may differ from earlier national releases because of revisions and differences in methodology.
The wage comparison uses OECD average gross annual wages per full-time-equivalent employee at constant prices. The household-income comparison uses real disposable income per capita from the OECD’s May 2026 snapshot, distributed through DBnomics.
Europe-5 is an equal-country average. Country indexes are calculated before averaging. The shaded range in the trend charts represents the five countries’ minimum and maximum, not statistical uncertainty.
The immigration comparison covers standardised permanent-type admissions in 2020–2024. It is not a measure of total arrivals or net migration. US observations follow the fiscal year.
Trade values are in current Canadian dollars unless otherwise indicated. Export receipts are not the same as domestic value added. Tariff outcomes and European scenarios are interpreted analytically; no unsupported causal GDP estimate or accession dividend is assigned.
Principal sources
Originally published on Substack.
Segui Roberto Balbino su Substack